
Clinical Guideline for Assessing Flash Visual Evoked Potentials in Laboratory Dogs and Normal Data for Beagle Dogs
by D Torres* & MC Tovar
Department of Medicine and Animal Surgery, Faculty of Veterinary
Medicine, University of Murcia, Spain
 Correspondence: Desiree Torres, DVM, PhD
C/ Félix Martí Alpera, nº 50, 7ºA. Cartagena 30205, Murcia, Spain.
Mob. +34 658019373
Fax +34 868884737
Email denisets7@hotmail.com
Summary
Visual evoked potentials (VEPs) are useful to evaluate the visual
pathway integrity from ganglion cells of the retina to the visual
cortex. VEP could be applied to evaluate the effects on optic nerve
function following ophthalmologic treatments and in toxicity studies.
The aims of this research were to design a clinical protocol for
testing flash-VEPs during sedation and dissociative anaesthesia in
laboratory dogs, and to propose updated normal data for beagles.
The Flash-VEP technique was used in 12 beagle dogs after dark
adaptation, pupil dilation and an anaesthetic protocol. Two tests were
performed for each eye after monocular stimulation. Flash-VEP
waveforms consisted of 2 positive (P1, P2) and 2 negative (N1, N2)
peaks sequenced as P1, N1, P2, and N2, where P2 was the most prominent
peak. Peak times (ms) and peak-to-peak amplitudes (µV) were measured
to evaluate the time from light stimulation of retina to cortical
response and their electrical intensity, respectively. No
statistically significant difference was observed between right and
left eye data from all dogs (Student’s t test, p<0.05), with the
exception of P2 peak times.
The protocol described allows clinicians to accurately record
Flash-VEP in dogs. These results are reliable and reproducible, and
could be valuable for other laboratories and future studies as
standard background data to compare with when testing VEP in beagle
dogs.
Introduction
The most common electrodiagnostic technique used in veterinary ophthalmology, to evaluate retinal function, has been electroretinography. Nowadays, however, visual evoked potentials (VEPs) have been increasingly undertaken by specialised clinics to complete the visual system evaluation. In particular, this test records visual evoked responses as a result of light stimulation of retina and the conduction of the response along the visual pathway. These potentials are registered by scalp electrodes, filtered and averaged by an electrodiagnostic system and, finally represented as a waveform and data. Therefore, to obtain a typical VEP waveform it is necessary for there to be a normal conduction of visual information through all the visual pathway components (eyeball including retina, the optic nerve, optic chiasma, optic tract, lateral geniculate nucleus, optic radiations, primary visual cortex and visual association cortex). Consequently, this VEP procedure provides a complementary technique (together with ERG and clinical findings) for the diagnosis of central blindness due to a variety of pathological changes to the visual pathway.
Nevertheless, there are certain factors that limit the use of this
test: the equipment cost, the need of a clinician with specific
qualification, the complex calibration of the system, the difficulty
of interpretation of the results, and the inability to correlate the
results with the signal sources. Lately, the availability of VEP
equipment has extended their veterinary use. However, there is a need
for standard protocols to perform this technique in laboratory dogs
and also for specific normal data for each breed.
Several researchers have proposed VEP protocols for dogs (Sato et al., 1982; Sims et al., 1989; Strain et al., 1990), but some procedures seem to be invasive (intracranial screw
electrodes by Sato et al., 1982), stressful (systems to
restrain conscious dogs’ movements by
Sato et al., 1982 and Strain et al., 1990), or too
long to do within the working day (need to train dogs to adapt to a
semi-restraining support, and also spend 60 min in dark adaptation by
Sato et al., 1982). Hence our study was conducted in order to
establish a short, non-invasive and simple clinical protocol to obtain
objective and reliable values of visual pathway integrity.
Normal VEP data for beagle dogs have been reported about twenty-five
years ago (Strain et al., 1990), but our study proposes
updated data for this breed associated with changes to the protocol
(dark adaptation time, pupil dilation, sedation-anaesthesia protocol,
interocular difference evaluation). These data could be helpful
because calibration of the electrodiagnostic equipment is a complex
procedure. Nevertheless, it is advisable that each laboratory
calibrates its own electrodiagnostic equipment because it can
influence the results of the test (Odom et al., 2010).
Materials and methods
Animals
Twelve beagle dogs were selected as a representative sample, 11 male
and 1 female, aged from 2- to 5-years old, with body weights between
10-21 kg. All animals belonged to the Laboratory Animals Service of
Murcia University (Support Service to the Research (SAI); no. REGA
IS300305440012), which have been maintained and used in accordance
with the EU guidelines concerning the protection of animals used in
experimentation (86/609/EEC).
All dogs were clinically healthy, and a complete ophthalmologic
examination was also performed 24 hours before VEP testing. This
examination comprised: menace response, obstacle course, cotton-ball
test, pupillary light reflexes, indirect ophthalmoscopy to examine the
back of the eye, direct ophthalmoscopy with a slit lamp, and
electroretinography to evaluate retina cells.
A 40-min clinical protocol was designed for VEP testing. It was
composed of the following stages:
Preparation of the room
The room selected for electrodiagnostic recordings was in complete
darkness, and the environmental temperature was controlled to avoid
hypothermia of the anaesthetised dog.
Preparation of the dog
A 12-hour fasting period was necessary, prior to sedation-anaesthesia,
to avoid emesis during the testing process. Then a proper
sedation-anaesthesia protocol was selected to guarantee dog’s
relaxation, and to avoid electrical muscle activity that creates
signal artefacts in the recordings (Bichsel et al., 1988).
The drugs selected for sedation were a combination of medetomidine
hydrochloride (Domtor ® , Orion Pharma,
Espoo, Finland) (0.01 mg/kg) and butorphanol tartrate (Torbugesic
® , Fort Dodge Animal
Health, Iowa, USA) (0.3 mg/kg) intramuscularly applied. This
pre-anaesthetic medication reduces the dose of the anaesthetic agent
required to keep the dog relaxed, and also avoids the seizures induced
by dissociative drugs (Flaherty, 2009). The anaesthetic
protocol was completed with ketamine hydrochloride (Imalgene 500
® , Merial Laboratory
S.A., Barcelona, Spain) intravenously administered at a single dose of
5 mg/kg of body weight by catheterisation of the cephalic vein. This
dissociative drug was selected in order to keep the dog unconscious
during the entire test, and to relocate the eye in central position,
which is very important due to the ventromedial position of the eye
induced by medetomidine (Clark, 2009). In addition,
oxygenation was provided during the experimental procedure, the dog
was kept warm by using heat pads to avoid hypothermia, and ventilation
was also controlled by monitoring the dog.
While the dog was relaxed, administration of a mydriatic drug was
necessary to guarantee full dilation of the pupil; when a greater area
of the retina is stimulated, more intense responses are obtained in a
shorter time (Itoh et al., 2010). Then, 1% tropicamide
eyedrops (Colircusí tropicamida ® , Alcon Cusi, S.A.,
Barcelona, Spain) were instilled every 5 min for 15 min. Afterwards,
the dog was gently placed in sternal recumbence on the examination
table and the base of the head was kept horizontal.
During the preparation of the dog, a minimum of 20 min of dark
adaptation was performed prior to light stimulation. Furthermore, all
the recording procedure was performed in darkness to guarantee the
activity of rods. This type of photoreceptor predominates in
dogs’ retinas and consequently produces a stronger VEP response
than by only stimulating cones.
Electrode placement
Before fixing the electrodes, skin was shaved, cleaned and disinfected
with alcohol to provide good electrical connection between the
electrodes and the skin. Both eyelids were also spread with Barraquer
eyelid speculums to avoid blinking, due to the brightness of the flash
which is not sufficient to penetrate the eyelids.
Three gold disc scalp electrodes were selected (Odom et al., 2010) because they are of good quality, non invasive (avoids possible
infections caused by needle electrodes) and provide excellent
recordings (Perez-Salvador, 1999). These were located over
the scalp midline according to a modification of the International
10/20 System for humans, and fixed with a proper amount of conductive
paste (TEN 20 conductive ® , Weaver and company,
Colorado, USA). Then the active electrode (Oz) was located over the
occipital protuberance midline to register cortical responses; the
reference electrode (Fz) was fixed over the forehead midline just
between the eyes; and finally a ground electrode (Cz) was placed over
the vertex midline between both ears to complete the electrical
circuit.
Equipment organisation
All electrodes were connected to a single recording channel
differential amplifier and this to the central unit. A mini-ganzfeld
was also connected to the central unit. This was a handle
photostimulator lamp to provide monocular stimulations which are used
to detect functional asymmetries between both eyes.
The equipment employed in this laboratory was RETIsystem
® (Roland Consult,
Germany) with RETIport 32 as testing software. Equipment for humans
was used because this was the one available for our study; nowadays
there are many VEP equipments adapted to animals which are very
similar in calibration, and this guideline might be applicable to
both.
Calibration of the system
To prepare the testing system it was necessary to select Flash-VEP
technique (other VEP techniques such as pattern or onset/offset are
available) for light stimulation. This is the recommended technique
for recording VEP in anaesthetised dogs, because other techniques, for
instance pattern screens, need the active attention of the dog.
Furthermore, Flash stimulations also provide good recordings in humans
with media opacities (Odom et al., 2010), which means that it
could be of value in dogs with these problems.
Calibration of many stimulation and recording parameters was also
necessary. In this study, the recommendations from the International
Society for Clinical Electrophysiology of Vision (ISCEV) for humans
(Odom et al., 2010) were followed as summarised in Table 1.
Table 1. Stimulation and recording parameters for Flash-VEP calibrationa
|
Parameters |
|
Stimulus type |
White Flash |
Environmental luminosity |
Darkness |
Stimulation |
Monocular |
Eye-Miniganzfeld distance |
5 cm |
Flash strength |
3 cd·s·m-2 |
Background luminance |
30 cd·m-2 |
Stimulation frequency |
1 flash/s (1Hz) |
Electrode impedance |
5-7 KΩ |
Filters (-3 dB) |
1 Hz (low freq) – 100 Hz (high freq) |
Nº sweeps averaged |
64 |
Sweep time |
250 ms |
a Adapted from the ISCEV recommendations (Odom et al., 2010)
Light stimulation
Flashes of white light were the stimulus emitted from a mini-ganzfeld
held about 5 cm in front of the eye. At closer distances the eyelids
were touched which caused digital artefacts, and farther distances
resulted in less intense responses. Then monocular stimulations were
performed by covering the contralateral eye with a dark patch. Two
measures were taken from each eye in the same testing session to
assess repeatability (Odom et al., 2010). We always checked
the right eye first (two measurements) and then the left eye (two
measurements).
Recording and averaging system
The active electrode recorded the signals evoked by the visual cortex
in response to the visual stimulus. High pass and low pass filters
allowed extraction of visual-origin signals from background cerebral
activity unrelated to the visual stimulation; visual signals were then
amplified by the differential amplifier (Odom et al., 2010).
The last stage was to send the filtered responses to the central unit
in a PC, where the signals were averaged and represented as a
waveform.
Analysis and interpretation
All waveforms obtained were analysed in a specific way for each dog.
First, each waveform was analysed to study the general morphology, the
number of peaks and their polarity, the sequence of appearance, and
their size. Then, all waveforms were compared between both eyes in a
given dog and between dogs to find abnormalities and asymmetries.
Peak time and amplitude values were measured for each wave as suggested by ISCEV (Odom et al., 2010). Peak times, measured in ms, represented the time from light stimulation of retina to visual pathway cells’ response. This measure was taken from the beginning of the flash stimulation to each peak. Amplitudes, measured in µV, showed the voltage or electrical intensity of cellular responses. P1N1 and P2N2 represent the difference in voltage between peaks P1-N1 and P2-N2, respectively.
Finally, descriptive statistical analysis of data was performed by
using SPSS Statistics 16 ® software (SPSS Inc.
Illinois, USA) to establish range of normality, mean, standard error
of mean (SE), and standard deviation (SD) for a sample of 48 measures
(n=48); 2 measures from each eye in 12 dogs. Mean value was taken as
representative when SD ≤ R/3. In addition, mean interocular difference
value and Student’s t test for paired samples
(p<0.05) were used to evaluate the difference between
right and left eye measures in each dog.
Results
Waveform and data analysis
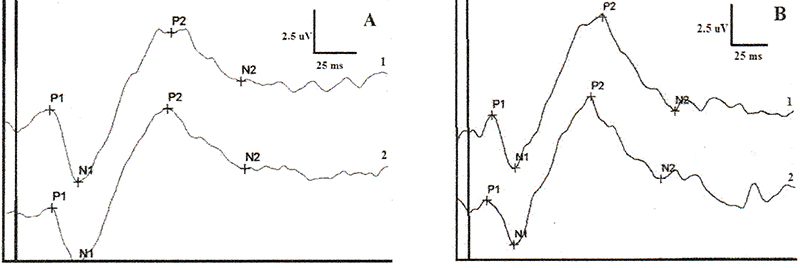
A total of 48 waveforms were obtained and compared. Waveform
morphologies resembled an ‘M’ form (Figure 1) and
consisted of four peaks sequenced as: P1, N1, P2, and N2. This
nomenclature was according to the polarity (P= positive, N= negative)
and the appearance order of the peaks. P1 and N1 were constant peaks
in all dogs. P2 was the most prominent peak in all dogs and the most
varying. However, P3 was not present in all dogs and that is the
reason why P3 was not included in our results.
Waveforms were similar between two measures taken in each eye and even
between eyes in a given dog (Figure 1). In addition, all waveforms
were compared between dogs and no remarkable difference was apparent
(Figure 2). Moreover, no peak or wave was absent or significantly
delayed, nor were exaggerated responses obtained.
Descriptive statistical values as range, mean, standard mean error
(S.E), and standard deviation (S.D) for peak times and amplitudes are
presented in Table 2 and 3, respectively.
Regarding peak times, mean data were representative (SD ≤ R/3), but later peaks such as P2 and N2 showed greater S.D and S.E than the previous ones. However, mean interocular differences were insignificant (from 1 to 2.75 ms) as shown in Table 2. Furthermore, paired t-test analysis between both eyes only showed a slight significant difference for P2 peak times.
Amplitudes, demonstrated less S.D (less than 1.4 µV) and S.E (less
than 0.4 µV) than peak times. In addition, amplitude data presented
great stability intra-individually, since mean interocular differences
were less than 0.5 µV and paired t-tests showed no significance (see
Table 3). Analysing these results, very low values (< 0.2 µV) for
peak amplitude were suggested to be abnormal as were exaggerated
responses.
|
|
Figure 1. Flash-VEP waveforms from a beagle dog (A: right eye, B: left eye) showing ‘M’ shape and composed by 4 peaks: P1, N1, P2, and N2. It can be noticed that the earliest peak has positive polarity. Two measures have been obtained from each eye. It can be seen the similarity of the waveforms from the same eye and between eyes in a given dog.
Click image to enlarge |
|
Figure 2. Flash-VEP waveforms from two different dogs (beagle A and beagle B). It has been represented an averaged waveform from 2 measures taken in right eye (1) and left eye (2). As can be appreciated, there is a clear similarity between waveforms from different dogs.
Click image to enlarge |
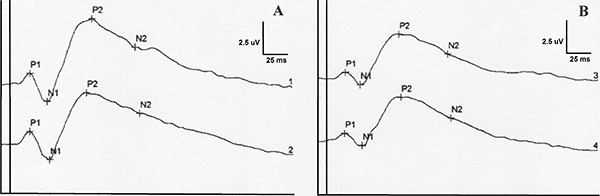
Table 2. BFlash-VEP peak time descriptive statistical data and p paired t-test values
|
P1 peak time (ms) |
N1 peak time (ms) |
P2 peak time (ms) |
N2 peak time (ms) |
||||
|
RE |
LE |
RE |
LE |
RE |
LE |
RE |
LE |
N |
12 |
12 |
12 |
12 |
12 |
12 |
12 |
12 |
Mean |
16.41 |
17.41 |
35.25 |
37.33 |
93.08 |
90.33 |
141.75 |
143.00 |
S.E. |
0.92 |
0.64 |
1.02 |
1.36 |
2.17 |
2.30 |
4.11 |
3.11 |
S.D. |
3.20 |
2.23 |
3.54 |
4.73 |
7.53 |
7.99 |
14.25 |
10.77 |
Range |
(8-21) |
(13-22) |
(30-40) |
(32-49) |
(79-103) |
(77-100) |
(120-161) |
(128-158) |
Mean interocular difference |
1.00 |
2.08 |
2.75 |
1.25 |
||||
|
p |
0.305 |
0.116 |
0.025 |
0.554 |
||||
RE= right eye; LE= left eye; S.E. = standard error of mean; S.D. = standard deviation
Table 3. Flash-VEP amplitude descriptive statistical data and p paired t-test values
|
||||
|
P1N1 amplitude (µV) |
P2N2 amplitude (µV) |
||
|
RE |
LE |
RE |
LE |
N |
12 |
12 |
12 |
12 |
Mean |
2.17 |
2.39 |
2.31 |
2.76 |
S.E. |
0.28 |
0.31 |
0.38 |
0.39 |
S.D. |
0.99 |
1.08 |
1.32 |
1.36 |
Range |
(0.74-4.16) |
(0.89-3.75) |
(0.40-6.03) |
(1.46-5.12) |
Mean interocular difference |
0.21 |
0.45 |
||
|
p |
0.405 |
0.187 |
||
RE= right eye; LE= left eye; S.E. = standard error of mean; S.D. = standard deviation
Discussion
VEP protocol quality and influential factors
Adult dogs were selected for this study because many authors (Kimotsuki et al., 2006) have demonstrated the influence of age on VEP morphology and data
(young dogs and senior dogs showed changes in data due to poor
development of the visual system and the reduction of myelinisation of
the central nervous system respectively). However, a future study
including normal data from different age groups could be of great
value.
Dark adaptation prior to light stimulation was essential because the
retina of dogs is mostly composed of rods, about 95% (Curtis & Lightfoot, 1993), which respond to luminance changes (this is in contrast to the
human retina which is dominated by cones). In previous examinations
(data not published), we found that larger amplitudes and shorter peak
times were recorded with longer dark adaptation times. However, more
studies are necessary to investigate this finding. At least 20 min of
dark adaptation was necessary to obtain waveforms with typical
morphology and reproducible results. Shorter adaptation times
registered weak responses and nearly flat waveforms. We think that a
1h-dark adaptation time (as used by
Kimotsuki et al., 2005 and 2006) is too long and
less practical for a clinical protocol. Strain et al.
(1990) reported a study with no dark-adaptation but, in our
laboratory, recordings in similar conditions showed low intensity
signals (data not published).
Regarding the use of mydriatic drugs, the ISCEV (Odom et al., 2010) suggests not using these drugs in Flash-VEP techniques for humans
but, in our studies with dogs, faster waves with higher intensity were
obtained due to the stimulation of a greater area of retina and
consequently the transmission to a larger area of the visual pathway.
This difference between protocols might be due to the greater number
of cones in the central retina of humans that makes possible the
recording of VEP without mydriatics. Furthermore, a recent study (Itoh et al., 2010) demonstrates the great influence of mydriasis on Flash-VEP
recordings in dogs. Another advantage of using mydriatics was to avoid
miosis caused by flashes (Sims et al., 1989).
According to several authors (Sato et al., 1982; Sims et al., 1989; Margalit et al., 2003;
Kimotsuki et al., 2005; Itoh et al., 2010) an anaesthetic protocol was essential to obtain relaxation of the
dog and avoid electrical artefacts from muscle activity, blinking, or
ocular movements. Nevertheless, it is important to take into account
that all sedative or anaesthetic drugs can cause depressive effects in
the CNS, as shown in many reports (Sato et al., 1982; Strain et al., 1990 and 1991). Despite this fact, the dissociative protocol produces lower
cortical depression than inhalatory anaesthesia as demonstrated by
Margalit et al. (2003). Moreover, as reported by
Clark (2009), the ventromedial rotation of the eye caused by
medetomidine was compensated with ketamine which relocated the globe
in central position. Local anaesthesia was also rejected since Ropo
et al. (1992) suggested that these drugs could alter
the electrical activity of the optic nerve.
In most of the reports referenced (Strain et al., 1990 and 1991; Kimotsuki et al., 2005 and 2006) needle electrodes or subdural electrodes (Margalit et al., 2003) were employed, but scalp electrodes are non-invasive and provided
good quality recordings.
Studies using 3 electrodes were reported several years ago (Strain et al., 1990, 1991; Kimotsuki et al., 2005, 2006; Itoh et
al., 2010) and showed good results like ours. Regarding electrode placement, a
modification of the International 10/20 System for electrode placement
in humans over the scalp’s midline was useful to record VEP in
dogs. The occipital protuberance midline was also the best place to
fix the active electrode because it correlates with the part of the
visual system that receives the majority of visual information (
Ofri et al., 1994; Kimotsuki et al., 2005), and also
where clear signals were recorded with no impedance problems. The
negative electrode was located between the eyes since, in our opinion,
this place does not correlate with the visual cortex and has less
influence from the light stimulus due to the distance from the
positive one. Finally, the ground electrode was placed between both
ears. Although it could be placed in another position by the ears (Kimotsuki et al., 2005) or forehead (Strain et al., 1990 and 1991), this position
provided a good electric circuit.
Concerning light stimulation, the eye to mini-ganzfeld distance
affected the eye stimulation, because distances greater than 10 cm did
not allow proper rod stimulation and, consequently responses were
slower and smaller. Moreover, covering the non stimulated eye was
necessary to assess monocular recordings. In this way, previous tests
(data not shown) without covering the contralateral eye with a dark
patch showed larger responses due to the combined responses of both
eyes. Furthermore, low responses when the uncovered eye was stimulated
may have been due to rods previously stimulated by the environmental
light coming from the other eye stimulation, and so the rods were
saturated.
Many authors (Uzuka et al., 1989; Perez-Cobo et al., 1994; Odom et al., 2010), in their studies with other species, prefer binocular stimulation
to study the global function of the visual system, but we prefer to
use monocular stimulations in order to detect asymmetries between
eyes.
VEP waveform and data
All the results showed a typical waveform that resembles an
‘M’ letter, as demonstrated in other works (Ropo et al., 1992; Perez-Cobo et al., 1994; Margalit et al., 2003;
Odom et al., 2010; Itoh et al., 2010). The ISCEV identified four peaks in humans sequenced as: N1, P1,
N2, and P2, but many studies in dogs (Strain et al., 1990 and 1991; Margalit et al., 2003; Kimotsuki et
al., 2005 and 2006) showed a sequence like ours: P1, N1, P2, and N2. Strain
et al. (1990, 1991) and Kimotsuki et al. (2005,
2006) registered a waveform with 5 peaks (P1, N1, P2, N2, and P3), but
P3 was very difficult to standardise in our study. Maybe the cause was
the difference in equipment; the particular calibration of each type
of equipment could modify the results (Odom et al., 2010).
All referenced studies in dogs showed the prominence of P2 and N2.
The global analysis of peak times presented great similarity with
other works in dogs (Strain et al., 1990 and 1991; Kimotsuki et al., 2005 and 2006), where P1 and N1 were the most stable values (smaller SD), and P2
and N2 showed more SD, although without being significant, perhaps due
to an artefactual influence in the later peaks. Thus, from our
knowledge, measures of all peaks have to be taken into consideration,
not only N2 and P2 as used by Itoh et al. (2010). Our peak
time values for P1 and N1 were greater than reported by Strain
et al. (1990) and Kimotsuki et al. (2005), probably
due to an anaesthesia effect. However, there was no significant
difference between two measures taken in each eye nor for the
interocular difference for a given dog (Figure 1 & 2), except P2
that showed a slightly interocular difference (p ≤ 0.05, but
not too significant p ≥ 0.01) possibly due to the special
sensitiveness of this peak to light stimulation factors. One of the
most important findings was the difference between humans (Odom et al., 2010) and our dogs’ peak times, since the earliest peak appears at
30 ms and 16 ms, respectively. The reason could be, as reported by
Strain et al. (1990), that there are many interspecies peak
time differences, and presumably for amplitudes as well.
Regarding wave amplitudes, several investigators reported (Sato et al., 1982; Uzuka et al., 1989; Perez-Salvador, 1999) P1-N1 and P2-N2 as the most interesting, but amplitudes presented
more variability than peak times. Our results differ from other
studies (Strain et al., 1990; Kimotsuki et al., 2005) as our
mean amplitudes were less (possibly due to central nervous system
depressing effect of anaesthesia) and our ranges of normality and SD
were less. Additionally, by checking twice both eyes, we demonstrated
no significant interocular difference for a given dog nor a
significant difference between two measures in the same eye (p ≥ 0.05) that verify data reproducibility.
Conclusion
It can be concluded that all recorded VEP responses were very similar
in waveform morphology, all peaks were constant in appearance, and
data showed no significant interocular difference. None of the reports
referenced have provided interocular data and t-test normal values for
all Flash-VEP peaks in beagle dogs. We consider it is very important
to estimate these measures for detecting possible asymmetries between
visual pathways derived from both eyes. We encourage all laboratories
to study morphology of the waveform (number of peaks and polarity),
peak time values (to estimate the time of response to light), and
amplitude values (to analyse the intensity of the response) in
Flash-VEP studies to assess visual pathway function in order to
complement electroretinography (ERG) and neurologic techniques. VEP
should be considered normal when the waveform is characteristic, peak
times are constant and within a normal range, and amplitudes are not
exaggerated. Finally, we propose our clinical protocol to be used in
future studies to obtain reliable VEPs for beagles; our results for
clinically normal beagles may provide useful background reference data
for future dog studies.
References
- Bichsel P, JE Jr Oliver, DB Coulter & J Brown: Recording of visual-evoked potentials in dogs with scalp electrodes. J. Vet. Intern. Med. 1988, 2, 145-149.
- Clark L: Monitoring the anaesthetised patient. In: Welsh L (ed). Anaesthesia for veterinary nurses. 2nd edn. Wiley-Blackwell, Oxford, UK, 2009.
-
Curtis R & RM Lightfoot: The canine fundus. In:
Petersen-Jones SM & SM Crispin (eds). Manual of small animal
ophthalmology. British Small Animal Veterinary Association, London,
UK, 1993.
-
Flaherty D: Anaesthetic drugs. In: Welsh L (ed).
Anaesthesia for veterinary nurses. 2nd edn. Wiley-Blackwell, Oxford,
UK, 2009.
-
Itoh Y, S Maehara, S Tomita & Y Izumisawa:
Flash-stimulated visual evoked potential in beagle dogs: effect of
mydriasis, stimulated side of eye and reproducibility. Anim. Eye.
Res. 2010, 29, 7-12.
-
Kimotsuki T, M Yasuda, S Tamahara, N Matsuki & K Ono:
Topographic analysis of flash visual evoked potentials in dogs. J.
Vet. Med. Sci. 2005, 67, 869-875.
-
Kimotsuki T, M Yasuda, S Tamahara, M Tomihari, N Matsuki & K
Ono:
Age-associated changes of flash evoked potentials in dogs. J. Vet.
Med. Sci. 2006, 68, 79-82.
-
Margalit E, JD Weiland, RE Clatterbuck, GY Fujii, M Mai, M
Tameesh, G Torres, SA D’Anna, S Desai, DV Piyathaisere, A
Olivi, E De Juan & MS Humayun: Visual and electrical evoked response recorded from subdural
electrodes implanted above the visual cortex in normal dogs under
two methods of anesthesia. J. Neurosci. Meth. 2003, 123,
129-137.
-
Odom VJ, M Bach, M Brigell, GE Holder, DL McCulloch, AP Tormene
& Vaegan:
ISCEV standard for clinical visual evoked potentials (2009 update).
Doc. Ophthalmol. 2010, 120, 111-119.
-
Ofri R, WW Dawson & DA Samuelson: The cortical area of
central vision in two dog breeds.
Vet. Comp. Ophthalmol. 1994, 4, 172-178.
-
Pérez-Cobo JC, M López De Armentia, S Sánchez-Suero & M
Pérez-Arroyo:
Visual evoked potentials in response to flashes in the cat cortex.
Rev. Esp. Fisiol. 1994, 50, 183-190.
-
Perez-Salvador E: Valor clínico de la exploración
electrofisiológica ocular, electrorretinografía y potenciales
evocados visuales, en los diferentes estadios evolutivos de las
cataratas con relación a su pronóstico visual postoperatorio (in
Spanish). PhD thesis, University of Madrid, Madrid, Spain, 1999.
-
Ropo A, P Ruusuvaara & K Setälä: Visual evoked
potentials after retrobulbar or periocular anaesthesia. Br. J.
Ophthalmol. 1992, 76, 541-544.
-
Sato S, S Sugimoto & S Chiba: A procedure for recording
electroretinogram and visual evoked potential in conscious dogs. J.
Pharmacol. Meth. 1982, 8, 173-181.
-
Sims MH, LJ Laratta, WJ Bubb & RV Morgan: Waveform
analysis and reproducibility of visual-evoked potentials in dogs.
Am. J. Vet. Res. 1989, 50, 1823-1828.
-
Strain GM, RM Jackson & BL Tedford: Visual evoked
potentials in the clinically normal dog. J. Vet. Intern. Med. 1990,
4, 222-225.
-
Strain GM, RM Jackson & BL Tedford: Postnatal
development of the visual-evoked potential in dogs. Am. J. Vet. Res.
1991, 52, 231-235.
- Uzuka Y, S Doi, M Tokuriki & H Matsumoto: The establishment of a clinical diagnostic method of the visual evoked potentials (VEPs) in the cat: the effects of recording electrode positions, stimulus intensity and the level of anesthesia. Jpn. J. Vet. Sci. 1989, 51, 547-553.