The effects of line crossing following selection in mice
by Anna Wolc1,2, Werner Schlote3 & Tomasz Szwaczkowski4
1Department of Animal Science, Iowa State University, Ames, USA
2Hy-Line International, Dallas Center, USA
3Berlin, Germany
4Department of Genetics and Animal Breeding, Poznan University of
Life Sciences, Poznan, Poland
 Correspondence: Tomasz Szwaczkowski
Department of Genetics and Animal Breeding
Poznan University of Life Sciences
Wolynska st. 33, PL 60-637 Poznan, Poland,
Tel: +48-61-8487249,
Fax: +48-61-8487148,
E-mail: tszwaczkowski@gmail.com
Summary
The objective of this study was to evaluate selection responses and heterotic effects in mouse line crosses after ten generations of selection. Four mouse lines were analyzed: G, L, W and C, selected for growth (body weight at 42 days [BW42]), tail length at 42 days [TL], litter size at birth [LS], and the control line, respectively. After 10 generations of selection the first set of crosses was created; in generation 12, backcrosses and three-way crosses were made. In the crosses the following traits were analyzed: body weight at 21, 42, 63 days, tail length at 42 days, litter size and litter mass at birth. Additive genetic effects of all lines were significant for BW (at all three measurement times) and TL. Heterosis was found for BW42 for the WxC combination, whereas the CxL combination tended to have a BW42 lower than expected from the line means. The same effect was observed for the CxG cross at day 63 with the effect increasing with age. With the exception of a maternal heterotic effect in the GxL cross, there was no significant effect on reproductive traits. The results show that 10 generations of line separation with selection on different traits (rather than divergent selection on a single trait) are enough to create genetic differences between the lines which result in a significant amount of heterosis for some parameters.
Introduction
Over the last centuries two main breeding approaches have been
employed for farm animal genetic improvement programs: selection and
crossbreeding. By definition, selection leads to a reduction of
genetic variability whereas crossbreeding stimulates genetic
diversity. The mouse is perceived as a suitable experimental model for
livestock breeding due to its short generation interval and high
reproductive ability. Relatively high evolutionary conservation of the
genome between mouse and livestock species has been noted, which
manifests itself in mutations of the same genes resulting in
corresponding phenotypes. For instance, mutations in the myostatin
gene cause hypermuscularity and decreased fat content in mice (McPherron et al., 1997; Bünger et al., 2004) and other species (McPherron & Lee, 1997; Mosher et al., 2007; Dall’Olio et
al., 2010). Also, single genes for ovulation rate have been detected in both
mice (Spearow et al., 1999) and livestock (Davis, 2005) and numerous other regions of conserved synteny between mice and
mammalian farm animals exist (Anderson, 2001). Moreover, as
Casellas (2011) concluded, the inbred strains of mice are
essential animal models for laboratory research, in which genetic
uniformity is required.
Hill (2011) commented that the role of new selection
experiments in the genomic era might decrease, however existing
selection lines still provide essential information on the genetic
architecture of quantitative traits. There are numerous examples of
effective selection in mice (Bünger et al., 2001). There also
have been selection experiments conducted to evaluate heterosis in
mice, showing both positive and negative effects (Roberts, 1965). Heterosis depends on the differences in allele frequencies between
parental populations at crossing, the magnitude of interaction within
a locus (dominance) and among loci (epistasis), as well as specific
parental genetic effects (mainly maternal). In animal populations
(contrary to plant breeding), diallel mating schemes have been rarely
employed, and have focused on the most efficient crossing schemes (Garcia-Casco et al., 2012). Most crossbreeding programs in animals use a crossbred (F1) female
as a dam of the final product to utilize maternal heterosis. It is
however not well established to what extent genetic differences
induced by short term selection could be utilized in crossbreeding.
The objective of this study was to evaluate selection response and
heterotic effects in mouse line crosses after 10 generations of
selection. The results will show if a short term directional selection
for simple traits followed by line crossing could generate significant
amounts of heterosis.
Materials and methods
Animals
The data were collected on four mouse lines with a common origin. The
base population was created from 40 males and 40 females collected
from pet shops, and then rotationally mated through 32 generations and
randomly mated in subsequent generations. From generation 65 of this
line, phenotypic selection was started in three directions: for
increasing body weight at 42 days (G line), increasing tail length at
42 days (L line) and increasing litter size at birth (W line). A
control line (C line) was also kept in parallel with the selection
lines. The active population varied between 20 and 40 pairs. A
detailed description of the selection procedure applied was described
by Bünger et al. (2004). In total, 8661
individuals (4373 males and 4288 females) were included the breeding
experiment. After the measurements of litter size and mass, litters
were standardized to 9 pups (excessive pups were removed to allow
uniform expression of growth potential). After 10 generations of the
breeding experiment a first set of crosses was created (male x
female): CxG, GxC, CxL, CxW. In generation 12 of the breeding
experiment backcrosses and three-way crosses were produced: CxCG,
GxCG, LxCG, WxCG, CxCL, GxCL, LxCL, WxCL, CxCW, CxGC, and some
additional two-way crosses: GxC. In generation 13, two of the
three-way crosses were repeated: CxGC, WxGC. The same scheme of
creating two- and three- way crosses was repeated in generations 15 to
18. The following traits were analyzed: body weight at 21, 42 and 63
days, tail length at 42 days, litter size and litter mass at birth.
Animals were kept in Macrolon cages (type 2 by EBECO, E. Becker u. Co
GmbH, Castrop-Rauxel, Germany) on standard litter (Altromin type, S
80150 by Altromin Spezialfutter GmbH u Co. KG, Lage, Germany). They
were weaned and separated by sex at day 21. In every generation,
matings were made at an age of 63±3 days. Mice were
fed ad libitum a pelleted food based on a standard formula
(Zuchtfutter für Ratten und Maeuse Nr 1314 by Altromin Spezialfutter
GmbH u Co. KG, Lage, Germany). Temperature varied between 20 and 240C
and relative humidity was 50-65%. All experimental procedures were
conducted in conformity with guidelines for the care and use of
laboratory animals at the Humboldt University in Berlin (Germany)
including control of health status of the mice.
Methods
Realized heritabilities were estimated from 10 generations of
selection as a linear regression of selection response on selection
differential. For each cross a genotype contribution from each
purebred line was calculated (Table 1) and additive genetic, maternal
genetic, individual heterotic and maternal heterotic effects were
estimated based on the following model:
Table 1 (Click here to open as PDF). Expected contribution of genetic effects to phenotype of the lines used in regression analysis to estimate additive direct (A), additive maternal (Am), dominance individual (D) and dominance maternal (M) effects of each line (line code included after underscore).
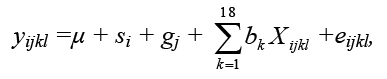
where:
yijkl – is the observation on the ijlk-th animal of
i-th sex born in the j-th generation and
k-th genetic group (pure or crossbred line),
μ is the overall mean,
si – is the fixed effect of i-th sex,
gj – is the fixed effect of j-th generation,
b1 to b3 are the partial regression coefficients
representing the additive effects of the lines;
b4 to b6 are the maternal effects of the lines,
b7 to b12 are the individual heterotic effects,
b13 to b18 are the maternal heterotic effects,
Xijlk is the proportion of genotypes for ijkl-th
individuals,
eijkl is the residual effect.
The parameters were estimated by the use of the PROC GLM of SAS
(2002-2010). Heritability of the traits before and after the
same selection experiment was previously analyzed using REML with the
animal model by Wolc et al.(2006) and Wolc
et al. (2009).
Results
Response to direct selection
The trait averages for consecutive generations under selection are
given in Table 2. Selection on body weight in the G line resulted in a
significant increase for this trait of almost 0.7 g per generation.
The average BW42 increased from 24.71 g in generation 1 to 31.88 g in
generation 11, with the realized heritability estimate of 0.41. In the
line selected for tail length (L line) the increase in tail length was
0.16 cm per generation. The difference between 11th and 1st generation
was 1.38 cm which is 15% of the tail length in L line at the beginning
of the experiment. Realized heritability for tail length was 0.34. In
the W line a highly significant increase in litter size was observed
of 0.16 pup per generation even though the estimate of heritability
(h2) was low (0.07). The increase of 1.14 pups per litter over 10
generations of selection accounted for 14% of the initial litter size.
Table 2 (Click here to open as PDF). Trait averages for consecutive generations under selection and linear regression coefficients of traits per generation
Correlations between traits
Pearson correlations between the recorded traits within lines are
listed in Table 3. BW42 was strongly positively correlated with BW63
within all lines and also positively but to a lesser extent with BW21.
The genetic component of this correlation can be confirmed by the
highly significant changes of BW21 and BW63 in the G line selected for
BW42. All body weight measurements were also positively correlated
with tail length. The response in body weight and tail length was not
symmetrical: L line increased by 19% in BW42 and 15% in TL whereas G
line increased by 29% in BW42 but only by 6% in TL. Big litters had
bigger total birth weight, but individual body weights at young age
(at 21 days) were negatively affected which was compensated later in
life.
Table 3 (Click here to open as PDF). Phenotypic correlation coefficients and their p-values between the analyzed traits within lines (C and L line above diagonals; G and W line below diagonals)
Crossing
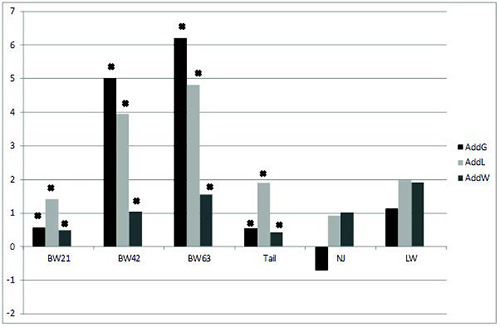
The regression analysis revealed significant positive additive effects
of all selected lines for all three body weight measurements and tail
length (Figure 1). For these traits, except for body weight at day 21,
the strongest additive effects were estimated in lines that were
directly selected for these particular traits. It should be stressed
that in the case of line L (selected on tail length) the additive
effects on body weight were relatively large and increased
proportionally with age of the animals. On the other hand, indirect
effects (effects other than direct additive effect) of lines G and W
on tail length were considerably smaller and not significant. The
positive W line effect on reproductive traits was not significantly
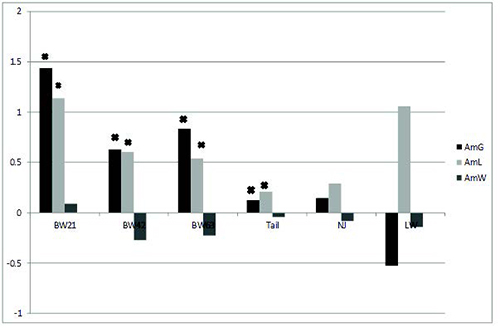
different from 0. Similar to additive effects, the maternal effect of
G and L lines was positive for body weight and tail length (Figure 2).
The maternal effects for reproductive traits were not significant.
However, when selection was focused on reproductive traits, the
maternal effects were negative not only for consecutive measurements
of body weight (expect for BW21) and tail length, but also for litter
size and litter mass. It may indicate negative relationships between
direct and maternal additive genetic effects for reproductive traits.
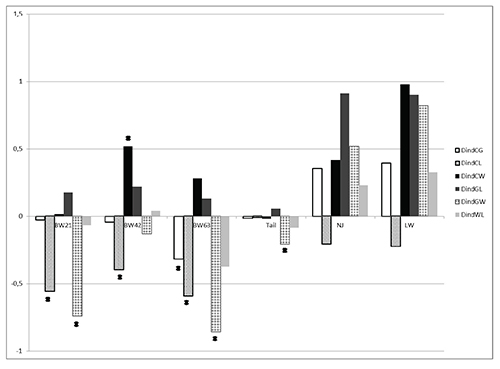
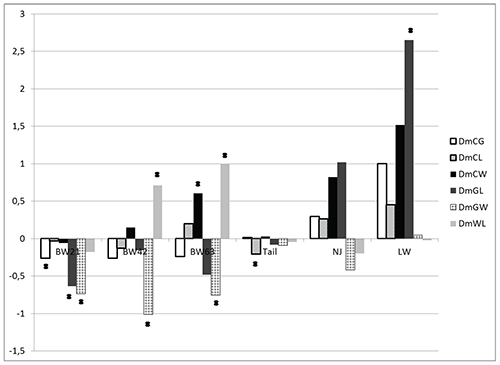
Individual and maternal heterotic effects are shown on Figures 3-4. In
general, both crossbreeding effects for respective traits were
relatively similar. The estimates of heterotic effects for body weight
and tail length were mostly negative, although variation among
different cross-variants has been observed. In contrast to additive
effects of pure lines, large individual and maternal heterotic effects
were demonstrated for reproductive traits, except for some cross
combinations. The largest positive heterosis was estimated for the
litter weight of GxL progeny (especially maternal heterosis, which was
statistically significant).
Heterosis was found for body weight at 42 days in the cross between W
and C lines, whereas the CxL combination tended to have body weight
averages lower than expected from the line means. The same was
observed for the CxG cross at 63 days with the effect increasing with
age. Again, with the exception of a maternal effect in the GxL cross,
there was no significant effect on reproductive traits but it is worth
noting that all except the CxL line combinations tended to have better
reproduction than purebred lines
|
|
Figure 1. Additive (direct) line effects (AddG, AddL, AddW) expressed relative to the control line on body weight (in gramms) at 21 (BW21), 42 (BW42), 63 (BW63) days of life, tail length – Tail (in cm), litter size – NJ (pups) and litter weight – LW (in gramms), * - for p < 0.05.
Click image to enlarge |
|
|
Figure 2. Maternal additive line effects (AmG, AmL, AmW) expressed relative to the control line on body weight (in gramms) at 21, 42, 63 days of life, tail length - Tail (in cm), litter size (pups) and litter weight (in gramms), * - for p < 0.05.
Click image to enlarge |
|
Figure 3. Individual heterotic effects (DindCG, DindCL, DindCW, DindGL, DindGW, DindWL) expressed relative to the control line on body weight (in gramms) at 21, 42, 63 days of life, tail length - Tail (in cm), litter size (pups) and litter weight (in gramms), * - for p < 0.05.
Click image to enlarge |
|
Figure 4. Maternal heterotic effects (DmCG, DmCL, DmCW, DmGL, DmGW, DmWL) expressed relative to the control line on body weight (in gramms) at 21, 42, 63 days of life, tail length - Tail (in cm), litter size (pups) and litter weight (in gramms), * - for p < 0.05.
Click image to enlarge |
Discussion
It is well known that the main criterion for effectiveness of applied
selection in a closed animal population without environmental changes
and non-overlapping generations is the realized heritability
coefficient. The major determinants of response to selection are
genetic variability of the studied population, accuracy of the
information sources (in this case own phenotype thus square root of
heritability) and intensity of selection. Generally, estimated
realized heritabilities for the three traits analysed in this study
correspond with results obtained by other authors. Moderate
heritability estimates for body weight are influenced by a complex
architecture of this trait. Body weight is a composite trait
aggregating both fat and non-fat tissue. According to the literature
it is influenced by both direct and maternal effects. As mentioned
earlier a number of single loci with a large effect on body weight
have been identified. Hence, heritability of this trait varies across
populations, as well as with the models and methods of analysis.
However, according to most studies it is relatively high for both mice
(Wolc et al., 2006; Wolc et al., 2009) and livestock
species (Utrera & Van Vleck, 2004). Ten generations of
selection led to significant additive differences between the lines
selected for traits with moderate or medium heritability confirming
numerous previous studies on the effectiveness of selection for body
weight in mice (Beniwal et al., 1992). On the other hand,
genetic drift could have also contributed to divergence of the lines.
Realized heritabilities for mouse body weight obtained in the present
study were smaller than both REML (Schlote et al., 2005) and
Bayesian estimates (Wolc et al., 2009) reported for the same
mouse populations using REML with the animal model. The difference in
the estimates may be influenced by changes in allele frequencies
across generations. As reported by Moreno et al. (2012) an
estimate of realized heritability can be affected by environmental
changes over time.
A moderate heritability estimate was obtained for tail length. It
corresponds with the complex nature of this character. Many decades
ago, single loci which affected tail length were described (Barnett, 1965). In our study, tail length was considerably correlated with body
weight although interestingly the response in one direction was
stronger than in the other: selection for tail length led to an
increase of body weight but the same was true to a lesser extent in
the opposite direction.
A number of studies have been conducted for reproductive traits.
Although single genes with larger effects on these characters exist,
the heritabilities are usually low. This corresponds with results
obtained in the present study. In the study by Holt
et al. (2005) a decline in additive genetic variance
over generations of selection was observed in a line selected for
reduced litter size; this agrees with a model allowing for genes with
larger effect changing in frequency. Other studies in mice (Beniwal et al., 1992) and chickens (Wolc et al., 2010) further justify the
questioning of infinitesimal model assumptions (genetic determination
of traits by a very large number of genes with very small effects).
Longer term experiments are needed to achieve a stable significant
response in reproductive traits (Holt et al., 2005).
Bakker et al. (1976) reported heterotic effects for
body weight in a cross with control or among selected populations
accounting for about 5% deviations from the mid-parent value. A
similar scale of heterosis was observed by Bhuvanakumar
et al. (1985) but only for a body weight measurement
on which direct selection was performed. Also Eaton (1953)
noted that the magnitude of heterosis may be age dependent. In our
study, the heterosis estimates were generally consistent for mice of
different age. Negative estimates of crossbred performance compared to
the parental average may suggest epistatic interactions; favorable
allele combinations for body weight traits were established in the
selection lines, which were broken by line crossing (Marani, 1968).
A tendency to a positive response to crossing was observed for
fertility traits. Some authors reported maternal effects on
reproductive traits in mammals (Koivula et al., 2009) and
birds (Szwaczkowski et al., 2000). In contrast to our
results, Hörstgen-Schwark et al. (1984) estimated
negative direct heterosis for female fertility and litter size in a
diallel cross of litter size and body weight selected mice lines.
Nagai (1971) found significant heterosis for mouse litter
mass but not for litter size. The results of molecular genetics
approaches (for example, finding overdominant QTLs) will provide more
insight into the background of heterosis and ways for it to be
utilized (Melchinger et al., 2007). Brunsch et al.
(1999) showed heterosis in litter size on mouse chromosome
19. Our results show that 10 generations of line separation with
selection on different traits (rather than divergent selection on a
single trait) are enough to create genetic differences between the
lines which resulted in a significant amount of heterosis.
Acknowledgements
The authors would like to thank Professor Lutz Bünger for helpful comments while preparing the manuscript.
References
-
Anderson L: Genetic dissection of phenotypic diversity in
farm animals. Nat. Rev. Genet. 2001, 2 (2), 130-138.
-
Bakker H, J. Nagai & E J Eisen: Average genetic and
heterotic effects on growth in mice selected for large 6-week body
weight or rapid postweaning gain. J. Anim. Sci.1976, 43 (6),
1145-1155.
-
Barnett S A: Genotype and environment in tail length in
mice. Exp. Phys. 1965, 50, 417-429.
-
Beniwal B K, I M Hastings, R Thompson & W G Hill:
Estimation of changes in genetic parameters in selected lines of
mice using REML with an animal model. 2. Body weight, body
composition and litter size. Heredity 1992, 69, 361-371.
-
Bhuvanakumar C K, C B Lynch, R C Roberts & W G Hill:
Heterosis among lines of mice selected for body weight. Theor.
Appl. Genet. 1985, 71, 44-51.
-
Brunsch Ch, U Philipp, P Reinecke, G. Moser, H. Geldermann, K
Koepke, W. Leucht & H. Stier: A new strategy of heterosis research in mice – approach and
results on chromosome 19. Arch. Tierz. 1999, 42 (1), 103-109.
-
Bünger L, U Renne & R C Buis: Body weight limits in
mice – Long term selection and single genes. Encyclopedia of
genetics (Reeve E.C.R. ed.) 2001, 337-370 Fitzroy Dearborn
Publishers, London, Chicago.
-
Bünger L, G Ott, L Varga, W Schlote, C Renhfeldt, U Renne, J L
Williams & W G Hill: Marker-assisted introgression of the Compact mutant myostatin
allele MstnCmot-dl1Abc into a mouse line with extreme growth effects
on body composition and muscularity. Genet. Res. Cambridge 2004, 84,
161-173.
-
Casellas J: Inbred mouse strains and genetic stability: a
review. Animal 2011, 5 (1): 1-7.
-
Dall’Olio S, L Fontanesi, L N Costa, M Tassinari, L Minieri
& A Falaschini: Analysis of Horse Myostatin Gene and Identification of Single
Nucleotide Polymorphisms in Breeds of Different Morphological Types.
J. Biomed. Biot. 2010, 542945 (available from www.hindawi.com).
-
Davis G H: Major genes affecting ovulation rate in sheep.
Genet. Sel. Evol. 2005, 37 (suppl. 1), 11-23.
-
Eaton O N: Heterosis in the performance of mice.
Genetics1953, 38 (6): 609-629.
-
Garcia-Casco J M, A Fernandez, M C Rodriguez & L Silio: Heterosis for litter size and growth in crosses of four strains
of Iberian pig. Livest. Sci. 2012, 147 (1): 1-8.
-
Hill W G: Can more be learned from selection experiments of
value in animal breeding programmes? Or is it time for an obituary?
J. Anim. Breed. Genet. 2011, 128 (2), 87-94.
-
Holt M, T Meuwissen & O Vangen: Long-term responses,
changes in genetic variances and inbreeding depression from 122
generations of selection on increased litter size in mice. J. Anim.
Breed. Genet. 2005, 122 (3), 199–209.
-
Hörstgen-Schwark G, E J Eisen, A M Saxton & T R Bandy:
Reproductive performance in a diallel cross among lines of mice
selected for litter size and body weight. J. Anim. Sci. 1984, 58
(4), 846-862.
-
Koivula W, I Straden & E A Mantysaari: Direct and
maternal genetic effects on first litter size, maturation age, and
animal size in Finnish minks. J. Anim. Sci. 2009, 87 (10),
3083-3088.
-
Marani A: Heterosis and inheritance of quantitative
characters in interspecific crosses of cotton. Crop Sci. 1968, 8
(3), 299-303.
-
McPherron A C, A M Lawler & S J Lee: Regulation of
skeletal muscle mass in mice by a new TGF-b superfamily member.
Nature 1997, 387, 83-90 doi:10.1038/387083a0
-
McPherron AC & S J Lee: Double muscling in cattle due
to mutations in the myostatin gene. Proc. Natl. Acad. Sci. USA 1997,
94 (23), 12457-12461.
-
Melchinger A E, H F Utz, H P Piepho, Z B Zeng & C C
Schon:
The role of epistasis in the manifestation of heterosis: a
systems-oriented approach. Genetics 2007, 177 (3), 1815–1825.
-
Moreno A, N Ibanez-Escriche, S Gracia-Ballesteros, C Salgado
& B Nieto: Correlated genetic trend in the environmental variability of
weight traits in mice. Livest. Sci. 2012, 148 (1-2), 189-195.
-
Mosher D S, P Quignon, C D Bustamante, N B Sutter, C S Mellersh,
H G Parker & H A Ostrander: A mutation in the myostatin gene increases muscle mass and
enhances racing performance in heterozygote dogs. PLoS Genet. 2007,
3, e79, DOI: 10.1371/journal.pgen.0030079.
-
Nagai J: Heterosis and combining and maternal abilities in
mouse litter weight. Can. J. Anim. Sci. 1971, 51 (3), 687-695.
-
Roberts K C: Some contributions of the laboratory mouse to
animal breeding research. Part I. Anim. Breed. Abstr. 1965, 33 (3),
339-353.
-
SAS 9.3. 2002-2010 by SAS Institute Inc., Cary, NC, USA.
-
Schlote W, A Wolc, T A Schmidt & T Szwaczkowski:
Development of variation in a random bred mouse population. 56th
Annual Meeting of the European Association for Animal Production.
5-8.06.2005, Uppsala, Sweden, 99.
-
Spearow J L, P A Nutson, W S Mailliard, M Porter & M
Barley: Mapping genes that control hormone-induced ovulation rate in
mice. Biol. Reprod. 1999, 61 (4), 857-872.
-
Szwaczkowski T, S Wężyk, P Piotrowski & K Cywa-Benko:
Direct and maternal genetic and environmental effects of fertility
and hatchability in laying hens. Arch. Geflüg. 2000, 34
(3), 115-120.
-
Utrera A R & L D Van Vleck: Heritability estimates for
carcass traits of cattle: a review. Genet. Mol. Res. 2004,
3 (3), 380-394.
-
Wolc A, W Schlote, T A Schmidt & T Szwaczkowski:
Inbreeding and variation in a randomly selected Berlin mouse
population. International Workshop Selection in Small Animal
Populations. March 16-17, 2006 - Berlin, Germany.
-
Wolc A, E Skotarczak, W Schlote & T Szwaczkowski:
Single-gene effects on body weight in selected and unselected mouse
lines detected by Bayesian marker-free segregation analysis. Scand.
J. Lab. Anim. Sci. 2009, 36 (2), 185-191.
- Wolc A, I M S White, M Lisowski & W G Hill: Contributions of genetic and environmental components to changes in phenotypic variation between generations. J. Anim. Breed. Genet. 2010, 127 (4), 255-260.