
Original scientific article
Determination of Body Surface Area in Japanese White Rabbits
by L Bai1,2, B Huang1,2, Y Chen1,2, S Zhao1,2, J Fan3, E Liu1,2 *
1Research Institute of Atherosclerotic Disease, Cardiovascular
Research Center, Xi’an Jiaotong University Health Science Center,
Xi’an, Shaanxi 710061, China
2Laboratory Animal Center, Xi’an Jiaotong University
Health Science Center, Xi’an, Shaanxi 710061, China
3Department of Molecular Pathology, Interdisciplinary
Graduate School of Medicine and Engineering, University of
Yamanashi, Yamanashi 409-3898, Japan
 Correspondence: Professor, Director Enqi Liu
Research Institute of Atherosclerotic Disease,
Xi’an Jiaotong University Cardiovascular Research Center,
Xi’an, Shaanxi 710061, China
Tel: +86-29-82657057
Fax: +86-29-82655362
E-mail: liuenqi@mail.xjtu.edu.cn
Summary
Accurate calculation of body surface area (BSA) is essential for many biomedical applications and conversion of drug doses among various species. In this study, forty Japanese white rabbits with a body weight of 2.5-3.0 kg were used to determine a precise formula and practical method for BSA calculation. Rabbit BSA was measured two ways: by coating with a kraft paper or by skin stripping, followed by calculation of the surface area planometrically. We compared the BSA data from these two methods and found there was no difference. The BSA data were subsequently entered into the Meeh’s formula (BSA =kW2/3), the most commonly used for experimental animals, to calculate the mean k constant from coating (11.35) and stripping (11.30). Furthermore, the Km factor, which is commonly used for dose translation based on BSA between human and animals, was calculated based on the formula (BSA=body weight (kg)/Kmfactor). TheKmfactor from coating and stripping was 12.38 and 12.40, respectively. In conclusion, coating is an easy and accurate way to measure rabbit BSA and can replace stripping. We also provide an accurate k constant and Km factor for Japanese white rabbits.
Introduction
Body surface area (BSA) is a crucial parameter of interest for many reasons including studies of body heat transfer, normalization of physiological responses, administration of drug doses, estimation of burnt skin percentage, calculation of volume of fluid replacement and calculation of nutritional needs (Crawford et al., 1950; Pinkel, 1958; Freireich et al., 1966; Widdowson, 1983; Vauthey et al., 2002; Gibson et al., 2003). In clinical practice, the calculations for determining starting dose in humans as extrapolated from animals always use the more appropriate normalization of BSA (Freireich et al., 1966; Schein et al., 1970; Reagan-Shaw et al., 2008). Therefore, how to accurately measure BSA in different species is becoming an important issue for both the scientific community as well as the general public.
Various formulae for BSA calculation have been reported in the
literature. For humans, a formula based on V (body volume) and L (body
length), BSA=(9πVL)0.5, has been derived (Wang et al., 2004b; Wang et al., 2004a). For animals, BSA is conventionally calculated using the Meeh
factor (k) times the body mass scaled to two thirds power
(BSA=kW2/3) (Gouma et al., 2012). However, Meeh
factors always vary according to species and size of the animal.
Hence, an accurate k constant value is required for each species and
weight range (Gilpin, 1996; Gouma et al., 2012).
According to guidelines of the US Food and Drug Administration (FDA),
the extrapolation of animal dose to human dose is correctly performed
only through normalization to BSA, which is represented in mg/m2 (Reagan-Shaw et al., 2008). TheKmfactor is used to convert the mg/kg dose to an mg/m2 dose. The
Kmfactor can be calculated as body weight (kg) divided by BSA (m2) (Reagan-Shaw et al., 2008). A dose in mg/kg is multiplied by Kmto convert to mg/m2. The human equivalent dose (HED) can be more
appropriately calculated by the formula: HED (mg/kg)=Animal dose
(mg/kg)x(Animal Km/Human Km) (Reagan-Shaw et al., 2008). Kmvalues vary greatly in different species. For example, theKmfactor for dog is 20, but the Km factor for mouse
is only 3 (Center for Drug Evaluation and Research, 2002).
Rabbits are widely used as animal models for various experiments and
testing due to being small, usually docile, easily restrained, cheap
to maintain and because they breed prodigiously (Fan et al., 2015; Peng et al., 2015; Csomos et al., 2016). Owing to the high similarity of lipid metabolism with humans,
rabbits are used as a model for human atherosclerosis (Yanni, 2004; Getz et al., 2012). Moreover, rabbits are used to study disorders of the eyes, skin,
heart, and immune system, as well as in studies of asthma, cystic
fibrosis, diabetes, lung disease and stem cell therapy (Kamaruzaman et al., 2013; Liao et al., 2015; Peng et al., 2015;
Zernii et al., 2015; Kuriyama et al., 2016). Therefore, determination of rabbit BSA has great significance for
many basic biomedical studies and clinical applications. To find an
easy way to calculate BSA and establish a more accurate formula, the
BSA of Japanese white rabbits was measured using coating and skin
stripping. We propose a simple and practical way to calculate BSA and
also provide an accurate k constant and Km factor
for Japanese white rabbits.
Materials and methods
Forty Japanese white rabbits (7-months-old, males), weighing 2.5-3.0 kg, were provided by the Laboratory Animal Center of Xi’an Jiaotong University. The animals were housed individually in cages (RB35-15G, Suhang Sci-technology Company, Suzhou, China). All animals were kept at room temperature 20-22oC, humidity 50-60%, under 12/12h of light/dark conditions. Rabbits were provided ad libitum with rabbit chow (Animal Feed Company of Beijing Keao Xieli, Beijing, China) and water. All animal experiments were pre-approved by the Xi’an Jiaotong University Institutional Animal Care and Use Committee, and performed in accordance with National legislation and the Convention ETS 123 (Council of Europe) and the Guide for the Care and Use of Laboratory Animals published by the US National Institutes of Health.
Coating procedure
Rabbits were weighed and anaesthetized with 10% chloral hydrate
dissolved in sterile water (1.5 ml/kg) (Xinyu Biotechnology Company,
Shanghai, China) via ear vein injection. A plain, non-slippery piece
of kraft paper, which was durable and did not wrinkle with use, was
used for coating the rabbits. The length of each rabbit, from nose to
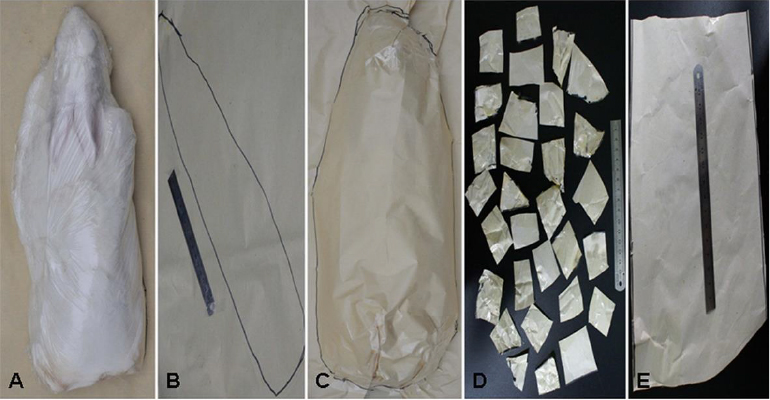
anus, was measured and recorded. Firstly, the whole body of rabbit was
wrapped up tightly by plastic wrappers with several small holes for
breathing (Fig. 1A). Then, the rabbit was placed onto the downside
paper, ventral side facing down with tail, front and rear legs hidden
below the ventral side, and the ventral surface of the rabbit was
marked on the downside paper (Fig. 1B). Subsequently, the upside paper
was held very tight and close to the dorsal surface of the rabbit,
until it reached the downside paper. Scotch tape was used to seal
wrinkles. At this position, the dorsal-lateral surface area of the
animal was carefully marked on the coating paper (Fig. 1C). The
coating paper was not as flat as the paper which covered the
rabbit’s torso. In an effort to make sure of the accuracy of the
measurement, we divided the coating paper into three parts that is
head, buttock and torso. To make sure the head and buttock parts were
flat enough for measuring, these parts were cut into several pieces of
paper (Fig.1D). After that, the small pieces of paper of head and
buttock, and the torso paper, were photographed (Fig.1E). Afterwards,
the front leg of the rabbit wrapped with plastic wrappers was placed
on the downside paper and marked on the downside paper (Fig. 2A). The
coating paper was pressed gently against the downside paper, so that
the front leg was enclosed between them (Fig. 2C). The edge was marked
on the upside paper (Fig. 2E). The same procedure, as described for
the front legs, was used to determine the surface area of the rear
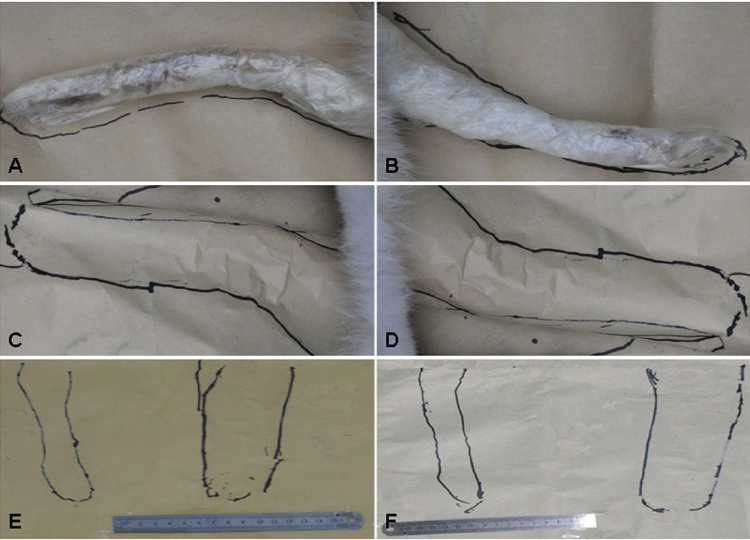
legs (Fig. 2B, 2D, 2F), ears (Fig. 3A, 3B) and tail (Fig. 3C, 3D, 3E,
3F). All the pieces of paper were collected and photographed (Fig. 1D,
1E). The surface area of each part was measured using image analysis
software (WinROOF Ver.6.5, Mitani Co., Ltd., Fukui, Japan). The total
BSA area was calculated by addition. All rabbits survived this part of
the study.
Skinning procedure
After being measured by kraft paper, rabbits were killed by injection
of sodium pentobarbital (100mg/kg) via the ear vein, and then skinned.
The epidermis of each rabbit was stripped. Then, the stretched pelt
was put on a board smoothly and photographed immediately. Rabbit BSA
was also measured by WinRoof software.
Statistical analysis
The group sizes were decided by the equation:
N=2+C(S/d)2. N, group size; C, constant
obtained according to α and β; S, standard deviation; d,
effect size. The statistical power was assumed as 0.9, and α was 0.05.
Data are expressed as mean ± SD. A statistically significant
difference between means was determined by using the t-test. All
statistical procedures were performed using SPSS (SPSS version 13.0,
Statistical Package for the Social Sciences software, SPSS, Chicago,
IL, USA). Differences were considered statistically significant at
P <0.05.
|
|
Figure 1. The basic steps of the suggested
procedure of BSA measurement in rabbits. A. the rabbit was
wrapped with the plastic wrappers and kept ventral side faced
down. B. The shape of the ventral surface area was marked on the
kraft paper. C. the dorsal-lateral surface area of the rabbit
was carefully marked on the coating paper. D. The coating paper
was cut into several small pieces. E. The shape of torso
area. Click image to enlarge |
|
Figure 2. The basic steps of the suggested
procedure of leg surface area measurement in rabbits. A. the
front leg of the rabbit was wrapped with the plastic wrappers
and placed on the kraft paper. B. the rear leg of the rabbit was
wrapped with the plastic wrappers and placed on the kraft paper.
C. the front leg surface area of the rabbit was carefully marked
on the coating paper. D. the rear leg surface area of the rabbit
was carefully marked on the coating paper. E. The shape of the
front leg surface area was marked on the kraft paper. F. The
shape of the rear leg surface area was marked on the kraft
paper. Click image to enlarge |

|
Figure 3. The basic steps of the suggested
procedure of ear and tail surface area measurement in rabbits.
A. The ear of the rabbit was placed on the kraft paper. B. The
shape of the ear surface area was marked on the kraft paper. C.
the tail of the rabbit wrapped with the plastic wrappers was
placed on the kraft paper (ventral side faced down). D. The
shape of the tail surface area was marked on the kraft paper. E.
the tail surface area of the rabbit was carefully marked on the
coating paper. F. The shape of the tail surface area was marked
on the coating paper. Click image to enlarge |

|
Figure 4 Comparative analysis of BSA, k
constant value and Km factor in rabbits. A. There was no
difference between BSA-1 and BSA-2. B. k-1 value from BSA-1 was
similar to k-2 value based on BSA-2. C,
Km factor -1 was also similar to
Km factor -2. Click image to enlarge |
Results
BSA and k constant
BSA-1 (0.224) was calculated with data from alive rabbits (Table 1).
BSA-2 (0.223) was calculated with data from stripped rabbits (Table
2). The k constant for each rabbit was calculated based on the
Meeh’s formula (k=BSA/W2/3). Mean values for k-1 and k-2 were
11.35 and 11.30, respectively (Table 2). Statistical analysis
indicated that there was no significant difference between BSA-1 and
BSA-2 (P=0.69) (Fig. 4A). The analysis of the deviation
showed that it was very small between the BSA values from alive
rabbits and stripped rabbits (deviation : +0.4%) (Table 2). The
obtained k-1 and k-2 values were also not significantly different
(P=0.30) (Fig.4B). These results suggest that coating is an
effective method for BSA measurement, which can replace the skinning
method, and does not require rabbits to be sacrificed.
Km
factor
The Kmfactor is used to convert the mg/kg dose used in a study to an mg/m2
dose. It was calculated using the following formula:
Kmfactor=body weight (kg)/BSA (m2). Based on the obtained BSA-1 and
BSA-2 data, Km factor -1 (12.38) and
Km factor -2 (12.42) were obtained (Table 2).
There was no significant difference between
Km factor -1 and Km factor
-2 (P=0.45) (Fig. 4C), suggesting a reliable
Km value had been obtained using the paper
wrapping method.
Discussion
The rabbit is a widely used animal model both in biomedical and clinical research. The present study establishes an easy and effective way to estimate rabbit BSA, and also provides an accurate Meeh’s k constant and Km factor based on the two different methods. BSA is becoming a key factor for converting a dose from animals to humans, especially for phase I and phase II clinical trials (Kaestner et al., 2007; Reagan-Shaw et al., 2008). Currently, BSA-based dose calculation and translation is the most appropriate method, which is far superior to the simple conversion based on body weight. To improve therapeutic outcomes in clinical trials, more appropriate dose conversions are needed.
BSA measurement can be carried out by direct methods, indirect methods
and predictive formulae. Direct methods include coating, surface
integration, triangulation and three-dimensional whole-body scanning
(Breton et al., 2008; Cheung et al., 2009; Zehnder et al., 2012). Indirect methods can be classified as linear geometric and
photographic. Predictive formulae are usually generated from
population studies (WangHihara, 2004b; Lee et al., 2008).
These methods for BSA measurement have advantages and disadvantages.
Direct methods are more accurate, but usually complex, time-consuming
and impractical in both the experimental and clinical setting.
Indirect estimation methods are simple and convenient, but have less
accuracy. Predictive formulae are derived from many studies using
direct methods. Although the predictive formulae are straightforward
methods for BSA calculation and have been widely used, their
applicability has been frequently questioned due to the diversity of
species, weight and strains (Gilpin, 1996; WangHihara, 2004b; Cheung et al., 2009).
In the present study, rabbit BSA was calculated using coating and
skinning. With a group size of 40 and a standard deviation of 0.012, a
significant difference of more than 0.009 could have been shown with a
p-value less than 0.05 and a power of 0.9. The BSA data from alive or
stripped rabbits were very similar (0.224±0.012 vs. 0.223±0.010).
Thus, any real difference is likely to be smaller than this. We
presumed that differences were statistically significant at
P <0.05. This should be an acceptable confidence limit for
the method. Further analysis of the deviation between the BSA values
from alive rabbits and stripped rabbits showed that it was quite
narrow (deviation: +0.4%), which suggests that skinning can be
replaced by coating and there is no need to sacrifice rabbits in
future studies. More importantly, coating is a very simple, convenient
and easy method which is not only suitable for rabbits but also can be
applied to other small or medium laboratory animals.
For mammals, the BSA is usually calculated using Meeh’s formula
(BSA=kW2//3), which is the most commonly used for experimental animals
(Meeh, 1879; Diack, 1930; Gouma et al., 2012). BSA
calculation for domestic rabbits has been reported using CT-guided
modelling (Zehnder et al., 2012). The k constant was
determined to be 9.9 (range, 9.59 to 10) (Spector, 1956; Zehnder et al., 2012). In our study, Meeh k values (11.30 and 11.25) for Japanese white
rabbits were obtained using two measurement methods. The different k
values from these studies may be due to different strains, body
weights or ages.
In recent years, BSA has been widely used for conversion of drug doses
between different species, especially from animals to humans. The
Km factor, a crucial index, is usually used to convert the
mg/kg dose to an mg/m2 dose (Center for Drug Evaluation and Research, 2002; Reagan-Shaw et al.,
2008). The Kmvalues based on average BSA calculations for human, baboon, dog,
monkey, rabbit, guinea pig, rat, hamster and mouse have been reported
by the FDA (Center for Drug Evaluation and Research, 2002; Reagan-Shaw et al.,
2008). The Kmfactor for rabbits weighing 1.8 kg is 12 (Center for Drug Evaluation and Research, 2002; Reagan-Shaw et al.,
2008). In the present study, average Kmvalues of 12.38 and 12.44 based on BSA calculation using coating and
skinning were obtained, which are consistent with the FDA data. In
conclusion, we establish a simple way to calculate rabbit BSA, and
provide an accurate Meeh’s k constant and Kmvalues for dose translation between Japanese white rabbits and humans
or other animals.
Table 1. BSA data from alive rabbits
|
Rabbit code |
Ventral area (m2) |
Dorsallateral area (m2) |
Tail area (m2) |
Ear area (m2) |
Front leg area (m2) |
Rear leg area (m2) |
BSA-1 *(m2) |
Length (m) |
Weight (kg) |
1 |
0.038 |
0.098 |
0.004 |
0.024 |
0.020 |
0.027 |
0.210 |
0.41 |
2.76 |
2 |
0.041 |
0.093 |
0.004 |
0.017 |
0.019 |
0.034 |
0.209 |
0.42 |
2.65 |
3 |
0.036 |
0.101 |
0.005 |
0.024 |
0.027 |
0.032 |
0.225 |
0.43 |
2.76 |
4 |
0.032 |
0.098 |
0.005 |
0.019 |
0.016 |
0.038 |
0.208 |
0.43 |
2.54 |
5 |
0.048 |
0.113 |
0.004 |
0.028 |
0.024 |
0.034 |
0.251 |
0.45 |
3.15 |
6 |
0.036 |
0.094 |
0.004 |
0.022 |
0.022 |
0.031 |
0.210 |
0.43 |
2.60 |
7 |
0.039 |
0.103 |
0.004 |
0.024 |
0.022 |
0.031 |
0.223 |
0.43 |
2.75 |
8 |
0.042 |
0.107 |
0.005 |
0.025 |
0.015 |
0.031 |
0.225 |
0.42 |
2.74 |
9 |
0.045 |
0.112 |
0.004 |
0.026 |
0.018 |
0.024 |
0.230 |
0.43 |
2.77 |
10 |
0.049 |
0.108 |
0.004 |
0.024 |
0.017 |
0.029 |
0.232 |
0.43 |
2.80 |
11 |
0.047 |
0.109 |
0.005 |
0.027 |
0.016 |
0.028 |
0.231 |
0.43 |
2.84 |
12 |
0.050 |
0.111 |
0.004 |
0.023 |
0.018 |
0.029 |
0.234 |
0.44 |
2.93 |
13 |
0.035 |
0.094 |
0.004 |
0.023 |
0.022 |
0.029 |
0.207 |
0.45 |
2.53 |
14 |
0.037 |
0.101 |
0.005 |
0.026 |
0.017 |
0.026 |
0.212 |
0.45 |
2.57 |
15 |
0.046 |
0.102 |
0.005 |
0.028 |
0.024 |
0.029 |
0.235 |
0.46 |
2.96 |
16 |
0.041 |
0.097 |
0.005 |
0.022 |
0.020 |
0.032 |
0.218 |
0.44 |
2.69 |
17 |
0.039 |
0.097 |
0.004 |
0.023 |
0.022 |
0.028 |
0.213 |
0.44 |
2.63 |
18 |
0.040 |
0.097 |
0.004 |
0.024 |
0.022 |
0.028 |
0.215 |
0.43 |
2.66 |
19 |
0.040 |
0.108 |
0.004 |
0.023 |
0.023 |
0.025 |
0.223 |
0.43 |
2.83 |
20 |
0.045 |
0.101 |
0.005 |
0.025 |
0.018 |
0.030 |
0.224 |
0.44 |
2.73 |
21 |
0.043 |
0.115 |
0.004 |
0.018 |
0.021 |
0.034 |
0.235 |
0.43 |
2.87 |
22 |
0.045 |
0.095 |
0.004 |
0.021 |
0.019 |
0.028 |
0.211 |
0.42 |
2.63 |
23 |
0.050 |
0.102 |
0.006 |
0.023 |
0.021 |
0.030 |
0.232 |
0.42 |
2.87 |
24 |
0.040 |
0.122 |
0.004 |
0.023 |
0.018 |
0.030 |
0.236 |
0.43 |
3.02 |
25 |
0.042 |
0.102 |
0.004 |
0.024 |
0.021 |
0.030 |
0.223 |
0.43 |
2.72 |
26 |
0.046 |
0.107 |
0.005 |
0.024 |
0.019 |
0.028 |
0.229 |
0.43 |
2.84 |
27 |
0.044 |
0.110 |
0.004 |
0.024 |
0.019 |
0.029 |
0.231 |
0.43 |
2.85 |
28 |
0.044 |
0.112 |
0.004 |
0.022 |
0.021 |
0.029 |
0.233 |
0.45 |
2.92 |
29 |
0.045 |
0.105 |
0.004 |
0.022 |
0.021 |
0.028 |
0.225 |
0.43 |
2.75 |
30 |
0.043 |
0.113 |
0.004 |
0.021 |
0.021 |
0.029 |
0.231 |
0.45 |
2.94 |
31 |
0.045 |
0.094 |
0.004 |
0.020 |
0.018 |
0.026 |
0.207 |
0.48 |
2.55 |
32 |
0.045 |
0.105 |
0.004 |
0.023 |
0.019 |
0.031 |
0.228 |
0.43 |
2.77 |
33 |
0.045 |
0.110 |
0.005 |
0.023 |
0.021 |
0.031 |
0.234 |
0.43 |
2.96 |
34 |
0.043 |
0.107 |
0.005 |
0.023 |
0.017 |
0.026 |
0.221 |
0.44 |
2.75 |
35 |
0.039 |
0.094 |
0.004 |
0.023 |
0.017 |
0.025 |
0.202 |
0.43 |
2.48 |
36 |
0.048 |
0.122 |
0.005 |
0.026 |
0.021 |
0.029 |
0.251 |
0.44 |
3.07 |
37 |
0.045 |
0.113 |
0.005 |
0.023 |
0.021 |
0.029 |
0.236 |
0.44 |
2.96 |
38 |
0.045 |
0.11 |
0.005 |
0.024 |
0.018 |
0.027 |
0.229 |
0.45 |
2.73 |
39 |
0.047 |
0.114 |
0.004 |
0.025 |
0.016 |
0.029 |
0.234 |
0.44 |
2.93 |
40 |
0.037 |
0.096 |
0.004 |
0.022 |
0.016 |
0.026 |
0.201 |
0.43 |
2.51 |
|
|||||||||
Mean |
0.043 |
0.104 |
0.0043 |
0.023 |
0.020 |
0.029 |
0.224 |
0.435 |
2.78 |
SD |
0.004 |
0.007 |
0.0003 |
0.002 |
0.002 |
0.003 |
0.012 |
0.013 |
0.16 |
*BSA-1 was measured when animals were alive. SD, standard deviation.
Table 2. Individually calculated k values and Km factors using planimetric measurements
|
Rabbit code |
Weight (kg) |
BSA-1 *(m2) |
BSA-2 *(m2) |
Deviation (%) |
k-1* |
k-2* |
Km factor-1* |
Km factor-2 * |
1 |
2.76 |
0.210 |
0.214 |
-1.86916 |
10.67 |
10.88 |
13.14 |
12.90 |
2 |
2.65 |
0.209 |
0.213 |
-1.87793 |
10.91 |
11.12 |
12.68 |
12.44 |
3 |
2.76 |
0.225 |
0.224 |
0.446429 |
11.44 |
11.38 |
12.27 |
12.32 |
4 |
2.54 |
0.208 |
0.209 |
-0.47847 |
11.17 |
11.23 |
12.21 |
12.15 |
5 |
3.15 |
0.251 |
0.249 |
0.803213 |
11.68 |
11.59 |
12.55 |
12.65 |
6 |
2.60 |
0.210 |
0.211 |
-0.47393 |
11.11 |
11.16 |
12.38 |
12.32 |
7 |
2.75 |
0.223 |
0.226 |
-1.32743 |
11.36 |
11.51 |
12.33 |
12.17 |
8 |
2.74 |
0.225 |
0.221 |
1.809955 |
11.49 |
11.29 |
12.18 |
12.40 |
9 |
2.77 |
0.230 |
0.227 |
1.321586 |
11.66 |
11.51 |
12.04 |
12.20 |
10 |
2.80 |
0.232 |
0.223 |
4.035874 |
11.68 |
11.23 |
12.07 |
12.56 |
11 |
2.84 |
0.231 |
0.228 |
1.315789 |
11.52 |
11.37 |
12.29 |
12.46 |
12 |
2.93 |
0.234 |
0.232 |
0.862069 |
11.43 |
11.33 |
12.52 |
12.63 |
13 |
2.53 |
0.207 |
0.210 |
-1.42857 |
11.15 |
11.31 |
12.22 |
12.05 |
14 |
2.57 |
0.212 |
0.213 |
-0.46948 |
11.30 |
11.35 |
12.12 |
12.07 |
15 |
2.96 |
0.235 |
0.231 |
1.731602 |
11.40 |
11.21 |
12.60 |
12.81 |
16 |
2.69 |
0.218 |
0.219 |
-0.45662 |
11.27 |
11.32 |
12.34 |
12.28 |
17 |
2.63 |
0.213 |
0.212 |
0.471698 |
11.18 |
11.13 |
12.35 |
12.41 |
18 |
2.66 |
0.215 |
0.216 |
-0.46296 |
11.20 |
11.25 |
12.37 |
12.31 |
19 |
2.83 |
0.223 |
0.222 |
0.45045 |
11.15 |
11.10 |
12.69 |
12.75 |
20 |
2.73 |
0.224 |
0.221 |
1.357466 |
11.47 |
11.31 |
12.19 |
12.35 |
21 |
2.87 |
0.235 |
0.229 |
2.620087 |
11.64 |
11.34 |
12.21 |
12.53 |
22 |
2.63 |
0.211 |
0.213 |
-0.93897 |
11.07 |
11.18 |
12.46 |
12.35 |
23 |
2.87 |
0.232 |
0.229 |
1.310044 |
11.49 |
11.34 |
12.37 |
12.53 |
24 |
3.02 |
0.236 |
0.233 |
1.287554 |
11.30 |
11.15 |
12.80 |
12.96 |
25 |
2.72 |
0.223 |
0.221 |
0.904977 |
11.44 |
11.34 |
12.20 |
12.31 |
26 |
2.84 |
0.229 |
0.222 |
3.153153 |
11.42 |
11.07 |
12.40 |
12.29 |
27 |
2.85 |
0.231 |
0.223 |
3.587444 |
11.49 |
11.09 |
12.34 |
12.78 |
28 |
2.92 |
0.233 |
0.231 |
0.865801 |
11.41 |
11.31 |
12.53 |
12.64 |
29 |
2.75 |
0.225 |
0.226 |
-0.44248 |
11.46 |
11.51 |
12.22 |
12.17 |
30 |
2.94 |
0.231 |
0.233 |
-0.85837 |
11.26 |
11.35 |
12.73 |
12.62 |
31 |
2.55 |
0.207 |
0.209 |
-0.95694 |
11.09 |
11.20 |
12.32 |
12.20 |
32 |
2.77 |
0.228 |
0.221 |
3.167421 |
11.56 |
11.20 |
12.15 |
12.53 |
33 |
2.96 |
0.234 |
0.236 |
-0.84746 |
11.35 |
11.45 |
12.65 |
12.54 |
34 |
2.75 |
0.221 |
0.223 |
-0.89686 |
11.26 |
11.36 |
12.44 |
12.33 |
35 |
2.48 |
0.202 |
0.204 |
-0.98039 |
11.03 |
11.13 |
12.28 |
12.16 |
36 |
3.07 |
0.251 |
0.246 |
2.03252 |
11.88 |
11.65 |
12.23 |
12.48 |
37 |
2.96 |
0.236 |
0.235 |
0.425532 |
11.45 |
11.40 |
12.54 |
12.60 |
38 |
2.73 |
0.229 |
0.226 |
1.327434 |
11.72 |
11.57 |
11.92 |
12.08 |
39 |
2.93 |
0.234 |
0.237 |
-1.26582 |
11.43 |
11.57 |
12.52 |
12.36 |
40 |
2.51 |
0.201 |
0.205 |
-1.95122 |
10.88 |
11.10 |
12.49 |
12.24 |
|
||||||||
Mean |
2.78 |
0.224 |
0.223 |
0.433 |
11.35 |
11.30 |
12.38 |
12.42 |
SD |
0.16 |
0.012 |
0.010 |
1.566 |
0.25 |
0.17 |
0.23 |
0.23 |
*BSA-1, k-1 and Km factor-1 were calculated with data from alive
animals. BSA-2, k-2 and Km factor-2 were calculated with data from
stripped animals. Deviation of BSA from alive rabbits and stripped
rabbits (Deviation (%) = ([BSAalive - BSAstripped]/BSAstripped)
×100.
Acknowledgements
This work was partly supported by the National Natural Science Foundation of China (81200207, 81070250), and by the Fundamental Research Funds for the Central Universities (to Liang Bai).
References
-
Anderson D: Revision of Council of Europe Convention ETS
123 guidelines for the accommodation and care of animals used for
experimental and other scientific purposes. Altern. Lab. Anim. 2004,
32(Suppl 1A), 183-185.
-
Breton E, P Choquet, L Bergua, M Barthelmebs, B Haraldsson, JJ
Helwig, A Constantinesco & M Fischbach: In vivo peritoneal surface area measurement in rats by
micro-computed tomography (microCT). Perit. Dial. Int. 2008,
28(2), 188-194.
-
Center for Drug Evaluation and Research CfBEaR.
Estimating the safe starting dose in clinical trials for
therapeutics in adult healthy volunteers. Food and Drug Administration. 2002, Rockville, Maryland, USA,
U.S.
-
Cheung MC, PB Spalding, JC Gutierrez, W Balkan, N Namias, LG
Koniaris & TA Zimmers: Body surface area prediction in normal, hypermuscular, and obese
mice. J. Surg. Res. 2009, 153(2), 326-331.
-
Crawford JD, ME Terry & GM Rourke: Simplification of
drug dosage calculation by application of the surface area
principle. Pediatrics. 1950, 5(5), 783-790.
-
Csomos R, G Bosscher, C Mans & R Hardie: Surgical
Management of Ear Diseases in Rabbits. Vet. Clin. North. Am. Exot.
Anim. Pract. 2016, 19(1), 189-204.
-
Diack SL: The determination of the surface area of the
white rat. J. Nutr. 1930, 3(3), 289-296.
-
Fan J, S Kitajima, T Watanabe, J Xu, J Zhang, E Liu & YE
Chen: Rabbit models for the study of human atherosclerosis: from
pathophysiological mechanisms to translational medicine. Pharmacol.
Ther. 2015, 146, 104-119.
-
Freireich EJ, EA Gehan, DP Rall, LH Schmidt & HE Skipper: Quantitative comparison of toxicity of anticancer agents in
mouse, rat, hamster, dog, monkey, and man. Canc. Chemother. Rep.
1966, 50(4), 219-244.
-
Getz GS & CA Reardon: Animal models of atherosclerosis.
Arterioscler. Thromb. Vasc. Biol. 2012, 32(5),
1104-1115.
-
Gibson S & A Numa: The importance of metabolic rate and
the folly of body surface area calculations. Anaesthesia. 2003,
58(1), 50-55.
-
Gilpin DA: Calculation of a new Meeh constant and
experimental determination of burn size. Burns. 1996,
22(8), 607-611.
-
Gouma E, Y Simos, I Verginadis, E Lykoudis, A Evangelou & S
Karkabounas: A simple procedure for estimation of total body surface area and
determination of a new value of Meeh’s constant in rats. Lab.
Anim. 2012, 46(1), 40-45.
-
Kaestner SA & GJ Sewell: Chemotherapy dosing part I:
scientific basis for current practice and use of body surface area.
Clin. Oncol. (R Coll Radiol). 2007, 19(1), 23-37.
-
Kamaruzaman NA, E Kardia, N Kamaldin, AZ Latahir & BH
Yahaya: The rabbit as a model for studying lung disease and stem cell
therapy. Biomed. Res. Int. 2013,
2013, http://dx.doi.org/10.1155/2013/691830.
- Kuriyama K, S Fuji, Y Inamoto, K Tajima, T Tanaka, Y Inoue, R Ito, Y Hayashi, A Ito, S Kurosawa, SW Kim, T Yamashita &
-
T Fukuda: Impact of low-dose rabbit anti-thymocyte globulin
in unrelated hematopoietic stem cell transplantation. Int. J.
Hematol. 2016, 103(4), 453-460.
-
Lee JY, JW Choi & H Kim: Determination of body surface
area and formulas to estimate body surface area using the alginate
method. J. Physiol. Anthropol. 2008, 27(2), 71-82.
-
Liao J, W Huang & G Liu: Animal models of coronary
heart disease. J. Biomed. Res. 2015, 30,
doi:10.7555/JBR.30.20150051
-
Meeh K: Öberflächenmessungen des menschlichen Körpers. Z.
Biol. 1879, 15, 425-458.
-
Newcomer CE: The evolution and adoption of standards used
by AAALAC. J. Am. Assoc. Lab. Anim. Sci. 2012, 51(3),
293-297.
-
Peng X, JA Knouse & KM Hernon: Rabbit Models for
Studying Human Infectious Diseases. Comp. Med. 2015, 65(6),
499-507.
-
Pinkel D: The use of body surface area as a criterion of
drug dosage in cancer chemotherapy. Cancer. Res. 1958,
18(7), 853-856.
-
Reagan-Shaw S, M Nihal & N Ahmad: Dose translation from
animal to human studies revisited. FASEB J. 2008, 22(3),
659-661.
-
Schein PS, RD Davis, S Carter, J Newman, DR Schein & DP
Rall: The evaluation of anticancer drugs in dogs and monkeys for the
prediction of qualitative toxicities in man. Clin. Pharmacol. Ther.
1970, 11(1), 3-40.
-
Spector WS (1956). Surface area relationship: mammals In:
Spector WS, editor. Handbook of biological data. Philadelphia,
Sunders. 1956, 175.
-
Vauthey JN, EK Abdalla, DA Doherty, P Gertsch, MJ Fenstermacher,
EM Loyer, J Lerut, R Materne, X Wang, A Encarnacion, D Herron, C
Mathey, G Ferrari, C Charnsangavej, KA Do & A Denys: Body surface area and body weight predict total liver volume in
Western adults. Liver Transpl. 2002, 8(3), 233-240.
-
Wang J & E Hihara: Human body surface area: a
theoretical approach. Eur. J. Appl. Physiol. 2004a, 91(4),
425-428.
-
Wang J & E Hihara: A unified formula for calculating
body surface area of humans and animals. Eur. J. Appl. Physiol.
2004b, 92(1-2), 13-17.
-
Widdowson EM: How much food does man require? An evaluation
of human energy needs. Experientia Suppl. 1983, 44,
11-25.
-
Yanni AE: The laboratory rabbit: an animal model of
atherosclerosis research. Lab. Anim. 2004, 38(3),
246-256.
-
Zehnder AM, MG Hawkins, EA Trestrail, RW Holt & MS Kent: Calculation of body surface area via computed tomography-guided
modeling in domestic rabbits (Oryctolagus cuniculus). Am. J. Vet.
Res. 2012, 73(12), 1859-1863.
- Zernii EY, VE Baksheeva, EN Iomdina, OA Averina, SE Permyakov, PP Philippov, AA Zamyatnin & II Senin: Rabbit models of ocular diseases: new relevance for classical approaches. CNS Neurol. Disord. Drug. Targets. 2016, 15(3), 267-91.