
Original scientific article
Insulin dosing affects plasma levels of biochemical parameters in a time-dependent manner in Sprague-Dawley rats
by Vivi Flou Hjorth Jensena, Stine Bartelta, Anne-Marie Mølcka, Lene Andersenb, Søren Andersenc, and Ingrid Brück Bøgha
aDepartment of Toxicology, Safety Pharm and Pathology, Novo Nordisk
A/S, Maaloev, Denmark.
bDepartment of Development Bioanalysis 4, Novo Nordisk A/S, Maaloev,
Denmark.
cDepartment of Biostatistics & Clinical Reporting, Novo Nordisk
A/S, Soeborg, Denmark.
 Correspondence: Vivi F. H. Jensen, DVM, PhD
Department of Toxicology, Safety Pharm and Pathology
Novo Nordisk A/S, Novo Nordisk Park, Maaloev, Denmark
Email: vfhj@novonordisk.com , Tel: +45 31507319
Summary
Changes in levels of various biochemical blood parameters are used as indicators of metabolic effects or potential toxicity when performing non-clinical safety studies of new drug candidates in rats. Additionally, since biochemical blood parameters are often affected during safety testing of new insulin analogues the effect of insulin dosing on these parameters was investigated. Non-diabetic rats were dosed with either vehicle or insulin once daily for 28 days. On Day 28, biochemical blood parameters as well as insulin exposure were measured, at two hour intervals during a 24 h period, to investigate time-dependent as well as time-independent changes. Insulin dosing lowered plasma glucose level for 4 h, corresponding to the peak plasma insulin level. Chronic insulin dosing increased food consumption and bodyweights. Additionally, plasma urea as well as CK and LDH levels increased. Hyperphagia was most likely driven by hypoglycaemia thereby also increasing body weight through insulin-stimulated fatty acid uptake into adipose tissue. Increased urea, CK and LDH levels, suggests that the return to normoglycaemia was driven mainly by increased hepatic gluconeogenesis, as reflected by increased ureagenesis and skeletal muscle proteolysis (increased CK and LDH). A better understanding of insulin-induced changes to biochemical blood parameters may aid the interpretation of changes in these parameters in non-clinical safety studies with new drugs
Introduction
Changes in levels of biochemical blood parameters are used to evaluate the metabolic consequences or potential toxicity of new drug candidates when performing repeat-dose toxicity studies as part of the safety assessment (European Medicines Agency, 2010). According to regulatory guidelines, toxicological evaluation of new antidiabetic drug candidates are conducted using non-diabetic animals (US Food and Drug Administration, 2008; European Medicines Agency, 2001). The rat is often the rodent species of choice based on its pharmacological responsiveness and availability of extensive historical control data.
When dosing non-diabetic rats with insulin, the resulting
hypoglycaemia activates counter-regulatory responses, such as
increased food consumption and bodyweight (May & Beaton, 1968),
increased release of certain hormones (e.g. glucagon) (Cryer, 1993)
and increased hepatic glucose production (Gazola et al., 2007), which
are typically reflected in changes of biochemical blood parameters.
All of these changes challenge differentiation between effects caused
by the hypoglycaemia and potential off-target effects. Differentiation
is typically aided by including a comparator group dosed with human
insulin, serving as a reference ( European Medicines Agency, 2001).
Therefore, we have chosen human insulin for the present study. The
metabolic effects of insulin dosing and the counter-regulatory
response may potentially be influenced by the nocturnal feeding
pattern of rats, and both may affect several parameters involved in
glucose and fat metabolism such as liver glycogen stores (Marrino et
al., 1987). It is important to have detailed knowledge of the normal
metabolic counter-regulatory changes to hypoglycaemia in non-diabetic
animals when interpreting results from non-clinical safety studies.
Thus, an understanding of time-dependent changes in metabolism
following insulin dosing is pivotal and would allow for improved study
design and timing of blood sampling, as well as aiding interpretation
of any biochemical changes, in non-clinical safety studies in rats.
The aim of the present study was to investigate time-dependent effects
of repeated insulin dosing, during the early light period, in
non-diabetic rats on levels of biochemical blood parameters in
relation to exposure and blood glucose level.
This was done using insulin dosing for 28 days, causing recurrent
daily hypoglycaemia, and evaluating the effect on biochemical
parameters in blood taken every two hours following the end of dosing.
Materials & Methods
Animals
Male and female Sprague-Dawley (Crl:CD (SD), Charles River
Deutschland, Germany) rats approximately 7 weeks old were used
(n=60/sex, allowing for n=5/sampling time-point/sex, see below). Rats
were randomly allocated to groups (2 groups/sex, n=30/group/sex)
stratified for sex and body weight so that body weight was similar
between groups (mean±SD: control males: 240.7±8.8g, dosed males:
240.4±7.3g, control females: 166.8±6.8g, dosed females: 166.8±8.6g).
They were housed in transparent Macrolone type IV cages (floor area
1800 cm2, height 31 cm, 2-3 animals/cage) with Aspen wood shavings,
wooden blocks, paper strand material and plastic shelters. Each sex
and group was housed separately, with free access to water and a
standard complete pelleted rodent diet. Twice weekly the animals were
offered a small amount of cereal grain and maize. Animals were
acclimatized for approximately 7 days before the start of dosing on
Day 1. The facility was illuminated with a twelve-hour light/dark
cycle (lights on 6:00 AM) with controlled temperature, humidity and
air change (18-24˚C, relative humidity 30-70%, air change 8-15
times/hour). All procedures involving live animals were performed
under the Animal Licence authorized by the Danish Animal
Experimentation Inspectorate and according to local standard operating
procedures, Good Documentation Practice and OECD guidance on Humane
Endpoints for Experimental Animals in Safety Studies.
Study design
Animals were dosed subcutaneously once daily (at 8:00-10:00 AM) for 28
days with either Neutral Protamine Hagedorn (NPH) recombinant human
insulin (65 nmol/kg/day, NPH-Group) (Insulatard®, Novo Nordisk A/S,
Denmark) or vehicle (CTRL-Group) based on the body weight of each
animal. Animals were dosed group-wise, with the same order at each
dosing so as to allow for equal time between dosing. The vehicle was
an isotonic solution of glycerol 16.0 mg/ml, phenol 0.65 mg/ml,
m-cresol 1.5 mg/ml, disodium phosphate dihydrate 2.40 mg/ml and had a
pH of approximately 7.3. Bodyweight and food consumption were measured
twice weekly. On the last day of dosing (Day 28) blood samples (1.2
ml, sublingual vein) were obtained every two hours for a period of 24
hours, with first samples taken pre-dosing. Animals were sampled in
the same sequence as for dosing. Each animal was sampled on two
occasions 12 h apart (5 animals per sex/time-point) and terminated
after the last sample. Each sampling took <30 seconds and blood was
sampled into microtubes containing lithium heparin. The tubes were
gently inverted at least 10 times, centrifuged (2000 g, 10 minutes,
4°C) and the plasma separated and frozen (-20°C) in plastic tubes
within 30 min after centrifugation.
Levels of the following biochemical parameters were quantified in
plasma using a Pentra C400 Clinical Chemistry benchtop analyser
(HORIBA, Ltd., Japan): glucose, triglyceride, cholesterol, urea,
creatinine, total protein, albumin, globulin, albumin/globulin (A/G)
ratio, alanine aminotransferase (ALT), aspartate aminotransferase
(AST), alkaline phosphatase (ALP), lactate dehydrogenase (LDH),
creatine kinase (CK), sodium, potassium, calcium, inorganic phosphate
and chloride.
Levels of NPH insulin in plasma samples were quantified using a
commercially available ELISA kit (K6219, DAKO, Denmark) according to
the manufacturer’s instructions. The lower limit of quantification
(LLOQ) was 10 pmol/L. Samples were analysed in duplicate and mean
concentrations were reported.
Statistics
Each sex was analysed separately. Bodyweight and food consumption data
were analysed using a two-way repeated measures analysis of variance
(ANOVA) (effect of insulin dosing and time), followed by a post hoc
Sidak’s multiple comparisons in case of an overall significant effect
of dosing. All plasma measurement data from both groups (CTRL and NPH)
were analysed by a two-way ANOVA to test for overall effect of insulin
dosing, and to determine if it was dependent on time after dosing
(interaction). In case of an overall significant effect of dosing,
data were further analysed with post hoc Sidak’s multiple comparisons.
Additionally, bodyweight and food consumption data were analysed using
repeated measures ANOVA with post hoc Sidak’s multiple comparisons.
Unless otherwise stated, results are given as mean±SD. A p-value ≤0.05
was considered statistically significant.
Results
Animals
No clinical signs related to dosing of insulin (NPH-Group) or vehicle
(CTRL-Group) were observed. Bodyweights were generally significantly
increased from Day 14 in the NPH-Group compared to CTRL-Group in both
males and females (Fig. 1). On Day 28, bodyweights were increased by
4% and 3% in NPH- versus CTRL-Group for males and females,
respectively. Food consumption (data not shown) in females was
significantly increased in NPH- versus CTRL-Group (p=0.0318) generally
by 6-12% throughout the study. Food consumption in males was
generally, but not significantly, 7-10% higher in NPH- versus
CTRL-Group (p=0.1072), with an indication of a possible time-dependent
effect of insulin dosing (p=0.0661).
|
|
Figure 1. Body-weights Click image to enlarge |

Plasma NPH insulin levels: The NPH insulin plasma
concentration was <LLOQ in all CTRL samples (data not shown).
Plasma NPH insulin levels in the NPH-Group are shown in Fig. 2A+B.
Maximum exposure level was achieved 2 h after dosing, followed by a
gradual decline with levels approaching LLOQ 10-12 h after dosing.
|
|
Figure 2. Plasma NPH insulin levels Click image to enlarge |

Effect of insulin dosing on levels of biochemical blood
parameters
Overall changes of insulin dosing on biochemical parameters are
summarized in Table 1.
Table 1 A. Males
| Parameter | Change | P-value | F-value | DF |
| Glucose | ÷ | <0.0001a | 12.81 | 11 |
| Cholesterol | NC | <0.0001a | 4.263 | 11 |
| Triglyceride | ÷ | 0.0005 | 13.02 | 1 |
| Urea | + | 0.0231a | 2.158 | 11 |
| Creatinine | + | 0.0454a | 1.924 | 11 |
| Total protein | ÷ | 0.0200a | 2.208 | 11 |
| Albumin | ÷ | 0.0069a | 2.56 | 11 |
| Globulin | ÷ | <0.0001 | 23.5 | 1 |
| A/G ratio | ÷ | 0.0254 | 5.154 | 1 |
| ALT | NC | 0.3454 | 0.899 | 1 |
| AST | NC | 0.1014 | 2.736 | 1 |
| ALP | ÷ | 0.0063 | 7.797 | 1 |
| CK | + | 0.0299 | 4.861 | 1 |
| LDH | NC | 0.9563 | 0.003012 | 1 |
| Calcium | ÷ | 0.0018 | 10.32 | 1 |
| Chloride | + | 0.0047a | 2.69 | 11 |
| Sodium | ÷ | <0.0001a | 5.012 | 11 |
| Potassium | + | 0.0106a | 2.42 | 11 |
| Inorganic phosphate | NC | 0.3208 | 0.9960 | 1 |
Table 1 B. Females
| Parameter | Change | P-value | F-value | DF |
| Glucose | ÷ | <0.0001a | 10.17 | 11 |
| Cholesterol | ÷ | 0.00243 | 0.9367 | 1 |
| Triglyceride | NC | 0.1971 | 1.687 | 1 |
| Urea | + | 0.0080a | 2.511 | 11 |
| Creatinine | NC | 0.8915 | 0.0187 | 1 |
| Total protein | ÷ | 0.0035 | 8.946 | 1 |
| Albumin | ÷ | 0.0004 | 13.48 | 1 |
| Globulin | NC | 0.1599 | 2.006 | 1 |
| A/G ratio | ÷ | 0.0096a | 3.822 | 11 |
| ALT | NC | 0.9406 | 0.005604 | 1 |
| AST | NC | 0.6617 | 0.1927 | 1 |
| ALP | NC | 0.8415 | 0.04023 | 1 |
| CK | + | 0.0134a | 2.342 | 11 |
| LDH | + | 0.0363a | 2.002 | 11 |
| Calcium | NC | 0.2606 | 1.280 | 1 |
| Chloride | NC | 0.5360 | 0.3858 | 1 |
| Sodium | ÷ | 0.0114 | 6.654 | 1 |
| Potassium | + | 0.0059a | 2.612 | 11 |
| Inorganic phosphate | + | 0.0061a | 2.600 | 11 |
aInteraction between effect of dosing and time-point.
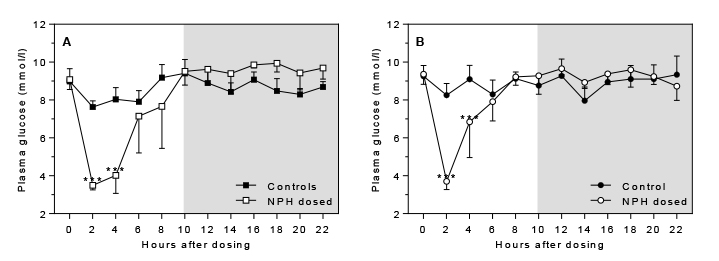
Glucose: Insulin dosing affected plasma glucose levels significantly in a time-dependent manner i.e. interaction between effect of group and time after dosing (p<0.0001 for either sex). After insulin dosing at time-point zero a significant plasma glucose lowering effect was seen for 4 h after dosing in males and females (Fig. 3A+B), with maximal effect on blood glucose levels 2 h after dosing, after which the effect tapered off with levels similar to controls approximately 6 h after dosing.
|
|
Figure 3. Effect of insulin dosing on plasma glucose
levels Click image to enlarge |
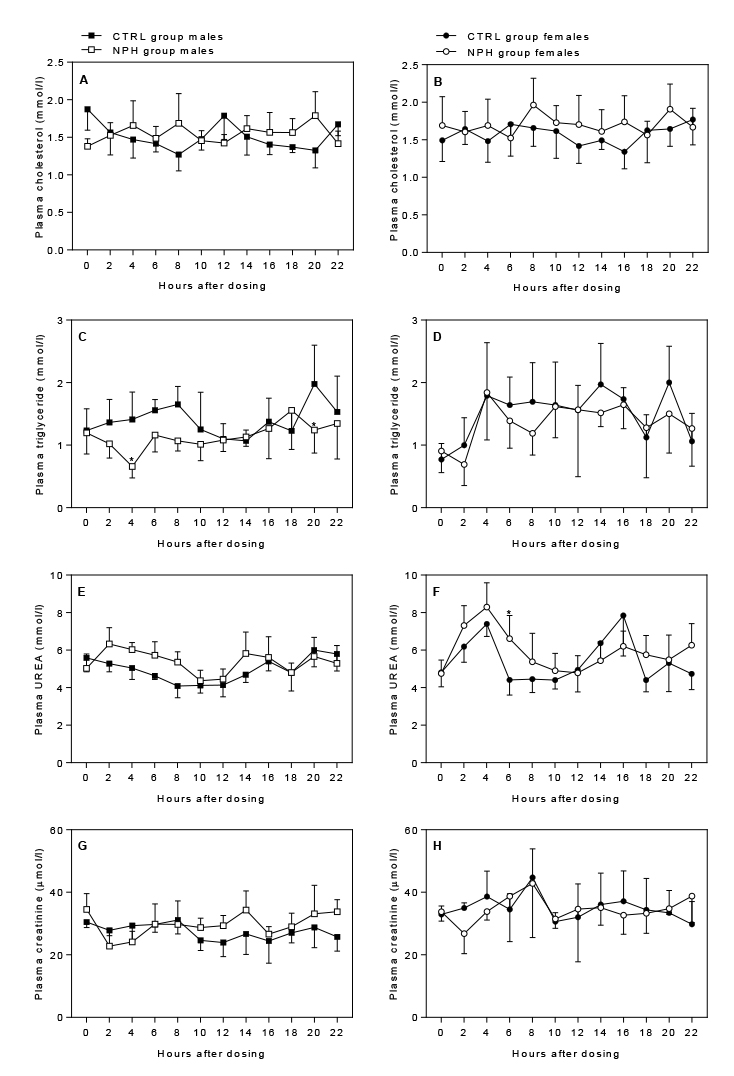
Cholesterol: There was no overall effect of insulin
dosing or time-point on plasma cholesterol levels in males, whereas
dosing caused an overall significant increase in cholesterol in
females (p=0.0243) (Fig. 4A+B). There was no significant difference
from controls at any of the individual time-points.
Triglyceride: In males, plasma levels were
significantly decreased by insulin dosing (p=0.0005), as well as
significantly affected by time-point (p=0.0349). Post hoc analysis
revealed significantly lower levels 2 h and 20 h after dosing
(p=0.0278 and p=0.0332) (Fig. 4C). In females, plasma triglyceride
levels were only significantly affected by time-point (p=0.0001), and
seemed to be lower during the early light period independent of dosing
(Fig. 4D).
Urea: Plasma levels were significantly affected by
insulin dosing in a time-dependent manner in both males (interaction,
p=0.0231) and females (interaction: p=0.0080). Levels seemed to be
increased for up to 10 h after insulin dosing in males and females
(Fig. 4E+F). However, post hoc analysis did not reveal any significant
differences between groups at individual time-points except for 6 h
after dosing in females.
Creatinine: Plasma levels were not affected by
insulin dosing in females; however, in males they were significantly
affected in a time-dependent manner (p=0.0454), where levels generally
seemed to be increased from 10 h after dosing (Fig. 4G+H).
|
|
Figure 4. Effect of insulin dosing on plasma levels of
cholesterol, triglyceride, urea and creatinine Click image to enlarge |
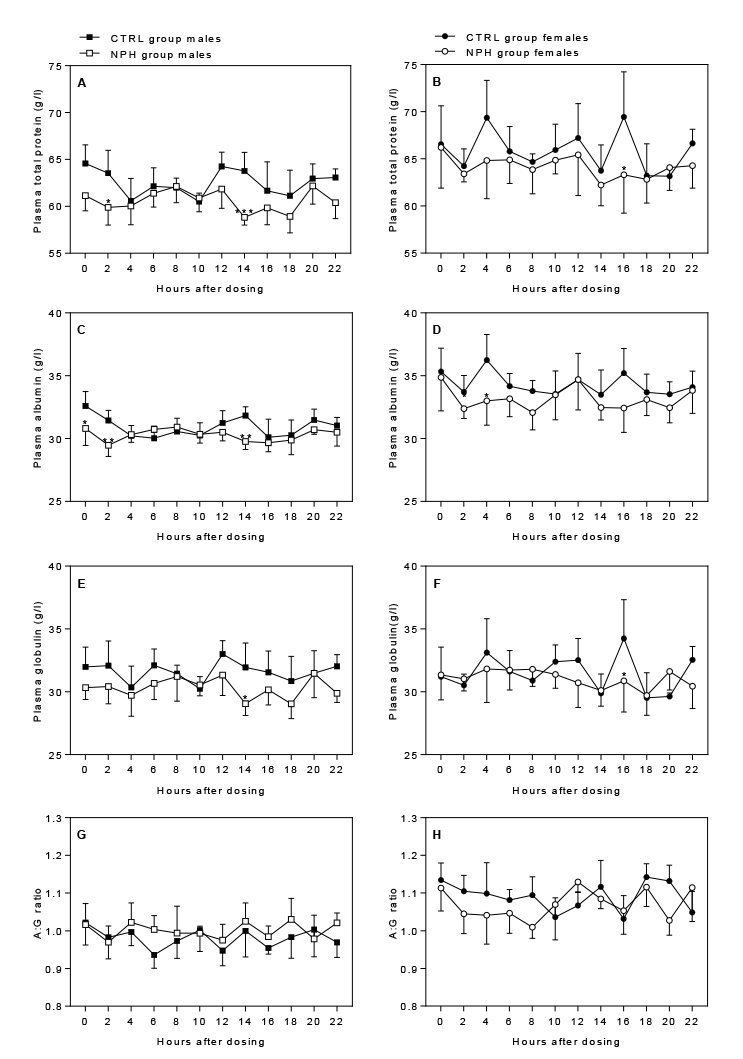
Total protein, albumin, and globulin: Insulin dosing significantly affected total protein levels in males in a time-dependent manner (p=0.0200), generally with lowered total protein levels from 12 h after dosing, although only significantly from the controls at 14 h (p=0.0007) as well as 2 h (p=0.0296) after dosing (Fig. 5A). In females, total protein levels were significantly affected by both insulin dosing (p=0.0035) and time-point (p=0.0184), generally with lowered levels but at the individual time-points this difference was only significant 16 h after dosing (p=0.0205) (Fig. 4B). In males, albumin levels were significantly affected in a time-dependent manner (p=0.0069), with significantly decreased levels immediately prior to dosing (p=0.0262) and at 2 h (p=0.0090) and 14 h (p=0.0056) after dosing (Fig 5C). In females, an overall decrease in albumin levels was seen following insulin dosing (p=0.0004) (Fig. 5D). Additionally, levels were significantly affected by time-point (p=0.0415), although only significantly lower than controls at 4 h after dosing (p=0.0342). Globulin levels were significantly affected by both insulin dosing in males (p<0.0001), with decreased levels in the NPH group, and time-point (p=0.0383), whereas levels in females were only significantly affected by time-point (p=0.0073) (Fig. 5E+F). Post hoc analysis revealed significantly decreased levels 14 h and 16 h after dosing in males and females, respectively. The A/G (albumin/globulin) ratio was significantly affected by insulin dosing in males (p=0.0254), with an increased ratio, whereas in females it was significantly affected in a time-dependent manner (p=0.0096), with decreased levels up to 8 h after dosing (Fig. 5G+H), although with no significant difference from controls at the individual time-points.
|
|
Figure 5 Effect of insulin dosing on plasma levels of
proteins Click image to enlarge |
ALT, AST and ALP: Insulin dosing did not affect ALT
(alanine aminotransferase) or AST (aspartate aminotransferase) levels
significantly in males and females, whereas AST levels were
significantly affected by time-point in females (p=0.0029) (Fig.
6A-D). ALP (alkaline phosphatase) levels in males were significantly
decreased by insulin dosing (p=0.0063) (Fig. 6E+F), but with no
significant differences at the individual time-points; no effects were
seen in females.
CK: Plasma levels of CK (creatine kinase) were
significantly affected by insulin dosing (p=0.0299) and time-point
(<0.0001) in males, with increased levels in the NPH-dosed group
primarily at 8 h, 14 h and 22 h (Fig. 6G), although not statistically
significantly different from controls at the individual time-points.
In insulin-dosed females levels were significantly increased in a
time-dependent manner (p=0.0134), with a pronounced significant
increase at 6 h (p=0.0001) (Fig. 6H).
|
|
Figure 6. Effect of insulin dosing on plasma levels of
enzymes Click image to enlarge |

LDH: Plasma levels of LDH (lactate dehydrogenase)
were only significantly affected by time-point in males (p<0.0001)
(Fig. 5I), whereas levels were significantly affected by insulin
dosing in a time-dependent manner in females (p=0.0363), which
generally were decreased, but with no significant changes at any of
the individual time-points (Fig. 6J).
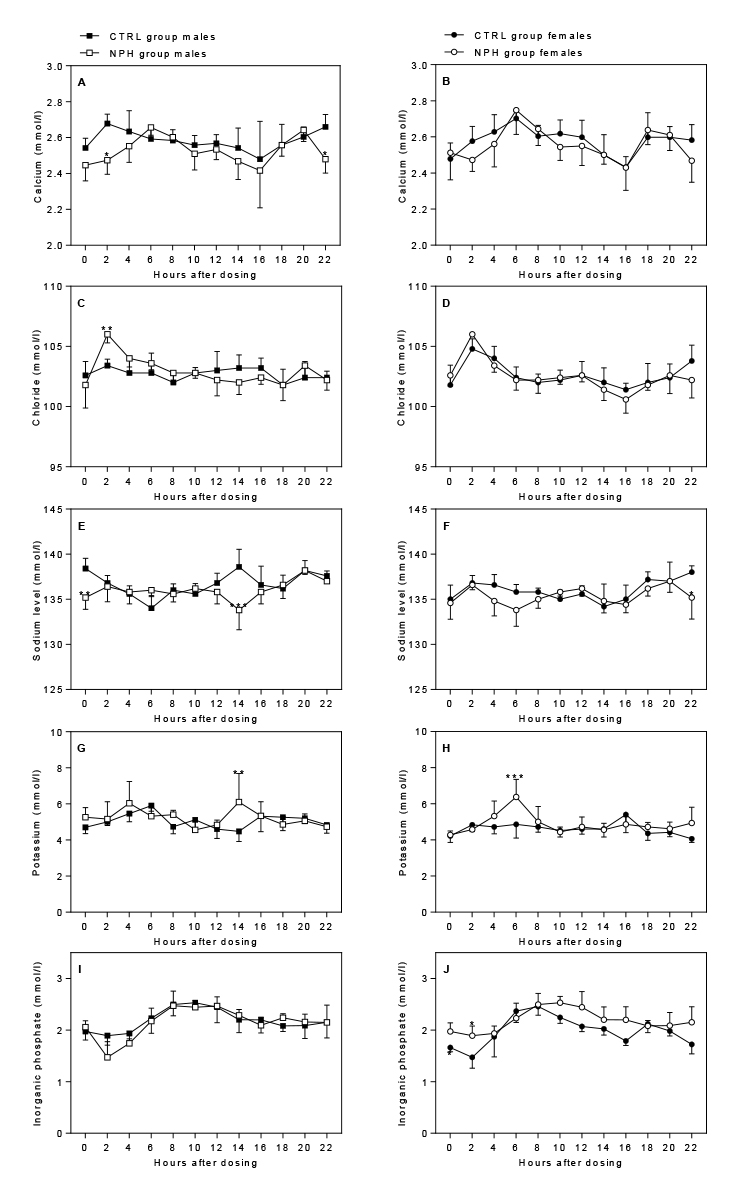
Calcium: In males, plasma levels of calcium were significantly
affected by time-point (p=0.0010) and insulin dosing (p=0.0018)
approaching a time-dependent effect (p=0.0548) (Fig. 7A); levels were
significantly lower 2 h (p=0.0107) and 22 h (p=0.0376) after dosing.
In females, calcium levels were only significantly affected by
time-point (p<0.0001), with maximum values at 6 h and minimum
values at 16 h (Fig. 7B).
Chloride: In males, plasma levels of chloride were
significantly affected by insulin dosing in a time-dependent manner
(0.0047), with significantly increased levels 2 h after dosing
(p=0.0023) (Fig. 7C). Chloride levels were not affected by insulin
dosing in females, whereas there was a significant effect of
time-point (p<0.0001) (Fig. 7D), with maximum values at 2 h and
minimum values at 16 h.
Sodium: In males, insulin dosing significantly
affected sodium levels in a time-dependent manner (p<0.0001), with
a significant decrease in levels 14 h after dosing (p<0.0001) and
24 h after dosing just prior to the next dose (p=0.0014) (Fig. 7E).
Insulin dosing also significantly affected plasma sodium levels in
females (p=0.0114), with a significant decrease at 22 h (p=0.0166)
(Fig. 7F).
Potassium: Insulin dosing significantly affected
plasma levels of potassium in a time-dependent manner in both males
(p=0.0106) and females (p=0.0059), with a significant increase 14 h
and 6 h after dosing in males (p=0.0013) and females (p=0.0002),
respectively (Fig. 7G+H). The pattern of changes was approximately
opposite to that observed for sodium.
Inorganic phosphate: Plasma levels were only
significantly affected by time-point (p<0.0001) and not by insulin
dosing in males, whereas in females levels were significantly affected
in a time-dependent manner (p=0.0061) with significantly increased
levels 2 h after dosing (p=0.0309) (Fig. 7I+J).
|
|
Figure 7. Effect of insulin dosing on plasma levels of electrolytes
Click image to enlarge |
Discussion
The present study investigated the time-dependent effects of insulin dosing for 28 days, which should cause recurrent daily hypoglycaemia for approximately 4 h/day, on biochemical parameters. These investigations were performed to increase knowledge about the fluctuations of biochemical blood parameters caused by insulin-dosing and/or insulin-induced hypoglycaemia in non-diabetic rats in order to aid interpretation of results in non-clinical safety studies.
Insulin dosing induced lowering of plasma glucose levels from
approximately 9 to <4 mmol/L with maximum effect 2 h after dosing,
coinciding with peak insulin exposure. This effect tapered off within
4-6 h after dosing, similar to what has been reported by others dosing
NPH insulin to diabetic rats at comparable doses (Bellush & Reid,
1994), and coinciding with declining insulin exposure. Insulin dosing
was accompanied by increased body weights, a known effect in both
non-diabetic and diabetic rats (Willing et al., 1990; Jensen et al.,
2015; Bellush & Reid, 1994). This is in line with the fact that
insulin stimulates uptake of plasma fatty acids from the blood into
adipose tissue (Gries et al., 1967); this was also reflected by
decreased triglyceride plasma levels in males for approximately 10 h
after insulin dosing, although only significantly 4 h after dosing,
coinciding with the duration of high insulin exposure. Insulin dosing
furthermore levelled out the peaks seen 12 h apart for cholesterol
levels in males. Despite the similar increase in bodyweights between
NPH-Group males and females, food consumption was significantly
increased only in females. Hyperphagia is a known effect of insulin
dosing driven by hypoglycaemia (May & Beaton, 1968). The
difference may be due to the fact that females are more
insulin-sensitive than males (Gustavsson et al., 2010; Gomez-Perez et
al., 2008) and, consequently, would have to increase food consumption
to a higher degree than males to maintain blood glucose levels similar
to insulin-dosed males, when given the same dose per kg bodyweight. An
alternative explanation could be that the study was too underpowered
to show a statistically significant difference with 12 levels on the
time factor included in the analysis. Also, the time-dependent effect
of insulin dosing approached a significant difference suggesting that
a higher power would show a significant effect. Increased urea levels
in the NPH-Group in both males and females most likely reflect
increased hepatic gluconeogenesis, a known counter-regulatory effect
to insulin dosing in rats (Borba-Murad et al., 1999; Gazola et al.,
2007). The supply of amino acids for hepatic gluconeogenesis during
periods of low glucose availability is primarily maintained by
skeletal muscle tissue through de novo synthesis as well as
proteolysis (Snell, 1980). In line with this, levels of the enzymes CK
and LDH in females, and CK in males, were transiently increased in the
NPH-Group. Increases in CK appeared 6-8 h after dosing, corresponding
to a few hours after the lowest blood glucose levels were reached.
This is similar to CK changes seen in rabbits with hypoglycaemia
induced by human insulin (Jiang et al., 1998; Jiang et al., 1996), and
where the increased CK was attributed to muscle tissue origin (Jiang
et al., 1998). This suggests that increased CK levels in the present
study were due to muscle tissue proteolysis supporting increased
hepatic gluconeogenesis. Thus, the increased urea, CK and LDH levels
in the present study probably reflect one of the vital
counter-regulatory mechanisms to re-establish normoglycaemia in the
rat.
In addition to the counter-regulatory measures to hypoglycaemia
mentioned above, increased plasma chloride, as seen in NPH-Group males
in the present study, is a known effect of insulin itself, due to
direct stimulation of chloride reabsorption in the kidney (Song et
al., 2006; Kirchner, 1988). Hypocalcaemia seen in males for 4 h after
insulin dosing was most likely caused by glucagon, secreted as an
immediate pancreatic counter-regulatory response to hypoglycaemia
(Burcelin & Thorens, 2001). Hypocalcaemia is a known effect of
increased glucagon levels in rats, mediated through stimulation of
calcium uptake by the bone and/or by decreasing bone resorption (Stern
& Bell, 1970; Williams et al., 1969). Furthermore, this
hypocalcaemic response has been shown to be rapid in onset (within 30
min after glucagon injection) and of short duration, lasting only a
few hours (Williams et al., 1969), corresponding well with what was
seen in the present study. Thus, in general, changes in plasma
electrolytes reflected the hyperinsulinaemia, either directly or
indirectly as part of the counter-regulatory response to
hypoglycaemia.
When reviewing the results from present study a limitation, which
should be considered, is the low n-value for each individual
time-point (4-5 animals). This may have masked some changes due to low
power in the post hoc analysis; for example, insulin dosing
significantly affected plasma cholesterol levels in females and ALP
levels in males, however, no significant difference was seen at any of
the individual time-points. Therefore, the results should be
interpreted with this in mind, as subtle changes may not have been
detected. Further investigation of changes at specific time-points may
therefore be warranted if these are of interest, and the results from
the present study could serve as a basis for power calculations to
determine the number of animals needed to show a significant
difference.
Regulatory guidelines state that toxicological evaluation of
antidiabetic drugs should be performed in non-diabetic animals
(European Medicines Agency, 2001; US Food and Drug Administration,
2008). Using non-diabetic rather than diabetic rats allows evaluation
of the metabolic responses to insulin dosing, without interference
from chronic hyperglycaemia. However, this also means that in contrast
to diabetic animals, in which insulin lowers hyperglycaemic blood
glucose levels down to normoglycaemia, as in the diabetic patient,
insulin dosing to non-diabetic animals will induce hypoglycaemia.
Consequently, it may be problematic to differentiate metabolic changes
caused by an insulin analogue from counter-regulatory changes caused
by the insulin-induced hypoglycaemia. Thus, it is important to have a
detailed knowledge regarding the normal metabolic counter-regulatory
changes to hypoglycaemia in non-diabetic animals when interpreting
results from non-clinical safety studies. Therefore, knowledge
regarding changes to biochemical blood parameters following insulin
dosing in non-diabetic animals is important, as well as any
sex-dependent effects as both females and males are included in these
studies. Furthermore, information regarding time-dependent changes of
these parameters following insulin dosing is important for optimal
timing of blood sampling. To investigate this, daily insulin dosing
was performed in non-diabetic rats for 28 days. On the last day of
dosing, blood was sampled prior to dosing and every two hours
following dosing to follow changes in blood parameters over time.
Insulin dosing affected several parameters in a time-dependent manner
coinciding with either peak exposure or as a delayed effect to the
insulin-induced hypoglycaemia, reflecting counter-regulatory measures
to regain normoglycaemia.
The effect of time of day is important to recognize when insulin
dosing is performed to both non-diabetic and diabetic rats, as this
may significantly affect the resulting blood glucose levels (Haughton
et al., 1999). In fact, a study has shown that obtaining glycaemic
control in diabetic rats using twice daily dosing required 50% higher
insulin doses at night compared with dosing in the morning (Haughton
et al., 1999). Insulin dosing in non-diabetic rats during the light
period, when blood glucose levels are lower, might thus increase the
risk of severe hypoglycaemia compared to an equivalent dose during the
dark period. In the present study, dosing was performed in the morning
and it could be interesting to include a group dosed in the evening to
evaluate any difference in response of biochemical parameters to
insulin-induced hypoglycaemia; they may be less sensitive to insulin
at night due to the circadian differences in eating behaviour and thus
metabolism.
Conclusions
Many of the biochemical blood parameters displayed a clear time-dependent effect following insulin dosing. Notably, effects were often not similar in males and females, emphasising the importance of including both sexes when evaluating effects on biochemical blood parameters. Additionally, as a consequence of this, optimal timing of blood sampling for the same parameter may be different in males and females.
In the NPH-Group, plasma levels of several of the biochemical
parameters reflected counter-regulatory responses to the
insulin-induced hypoglycaemia, typically in a time-dependent manner
related to the short duration of the hypoglycaemia (≤8 h after
dosing), which coincided with high insulin exposure.
Counter-regulation was characterised by increased bodyweight and
increased gluconeogenesis, reflected by increased ureagenesis,
skeletal muscle proteolysis (increased CK and LDH), as well as
hypocalcaemia. These changes were seen either coinciding with the
hypoglycaemia or as a delayed effect. This highlights the need for
careful consideration regarding the timing of blood sampling, i.e.
focusing on which biochemical parameters are of special interest, as
changes in different parameters are not necessarily present at the
same time and do not always coincide with maximum insulin exposure.
Results from the present study may aid the interpretation of changes
in biochemical blood parameters seen in non-clinical safety studies of
new drug candidates in rats.
Acknowledgement and funding
Studies were performed by Novo Nordisk A/S. This research received no specific grant from any funding agency in the public, commercial, private, or not-for-profit sectors.
Declaration of Conflicting Interest
The Authors declare that there is/are not conflict(s) of interest.
References
- Bellush ll & SG Reid: Metabolic and neurochemical profiles in insulin-treated diabetic rats. Am J Physiol. 1994, 266, R87-94.
- Borba-Murad GR, M Vardanega-Peicher, HM Souza, G Lopes, MH Fonseca, RB Bazotte: Hypoglycemia induced by insulin increases hepatic capacity to produce glucose from gluconeogenic amino acids. Zhongguo Yao Li Xue Bao. 1999, 20, 1083-1086.
- Burcelin R & B Thorens: Evidence that extrapancreatic GLUT2-dependent glucose sensors control glucagon secretion. Diabetes. 2001, 50, 1282-1289.
- Cryer PE: 1993. Glucose counterregulation: prevention and correction of hypoglycemia in humans. Am J Physiol. 1993, 264, E149-55.
- European Medicines Agency: Points to consider document on the non-clinical assessment of the carcinogenic potential of insulin analogues. 2001.
-
http://www.ema.europa.eu/docs/en_GB/document_library/Scientific_guideline/2009/09/WC500003252.pdf.
European Medicines Agency: Guideline on repeated dose toxicity. 2010. -
http://www.ema.europa.eu/docs/en_GB/document_library/Scientific_guideline/2010/03/WC500079536.pdf.
Gazola, VA, RF Garcia, R Curi, TC Pithon-Curi, MS Mohamad, EM Hartmann, HC Barrena, RB Bazotte: Acute effects of isolated and combined L-alanine and L-glutamine on hepatic gluconeogenesis, ureagenesis and glycaemic recovery in experimental short-term insulin induced hypoglycaemia. Cell Biochem Funct. 2007, 25, 211-216. - Gomez-Perez Y, E Amengual-Cladera, A Catala-Niell, E Thomas-Moya, M Gianotti, AM Proenz, I Llado: Gender dimorphism in high-fat-diet-induced insulin resistance in skeletal muscle of aged rats. Cell Physiol Biochem. 2008, 22, 539-548.
- Gries FA, S Potthoff, K Jahnke: The effect of insulin on the uptake of radioactive labelled plasma triglycerides by rat tissue in vivo. Diabetologia. 1967, 3, 311-317.
- Gustavsson C, K Yassin, E Wahlstrom, L Cheung, J Lindberg, K Brismar, CG Ostenson, G Norstedt, P Tollet-Egnell: Sex-different hepaticglycogen content and glucose output in rats. BMC Biochem. 2010, 11, 38.
- Haughton CL, DL Dillehay, LS Phillips: Insulin replacement therapy for the rat model of streptozotocin-induced diabetes mellitus. Lab Anim Sci. 1999, 49, 639-644.
- Jensen VFH, A-M Mølck, A Heydenreich, KJ Jensen, LO Bertelsen, L Alifrangis, L Andersen, H Søeborg, M Chapman, J Lykkesfeldt, IB Bøgh: Histopathological nerve and skeletal muscle changes in rats subjected to persistent insulin-induced hypoglycemia. J Toxicol Pathol. 2015, advpub.
- Jiang ZL, T Harada, M Kohzuki, M Kamimoto, T Sato: Plasma enzymic changes in insulin-induced hypoglycemia in experimental rabbits. Tohoku J Exp Med. 1996, 179, 219-222.
- Jiang ZL, T Harada, M Yokokawa, M Kohzuki, T Sato: Muscle damage induced by experimental hypoglycemia. Metabolism. 1998, 47, 1472-1476.
- Kirchner KA: Insulin increases loop segment chloride reabsorption in the euglycemic rat. Am J Physiol. 1988, 255, F1206-1213.
- Marrino P, D Gavish, E Shafrir, S Eisenberg: Diurnal variations of plasma lipids, tissue and plasma lipoprotein lipase, and VLDL secretion rates in the rat. A model for studies of VLDL metabolism. Biochim Biophys Acta. 1987, 920, 277-284.
- May KK & JR Beaton: Hyperphagia in the insulin-treated rat. Proc Soc Exp Biol Med. 1968, 127, 1201-1204.
- Shimomura Y, H Shimizu, M Takahashi, Y Uehara, M Negishi, I Kobayashi, S Kobayashi: Different effects of insulin administration time in streptozotocin-induced diabetic rats. Exp Clin Endocrinol. 1990, 96, 296-300.
- Snell K: Muscle alanine synthesis and hepatic gluconeogenesis. Biochem Soc Trans. 1980, 8(2), 201-213.
- Song J, X Hu, S Riazi, S Tiwari, JB Wade, CA Ecelbarger: Regulation of blood pressure, the epithelial sodium channel (ENaC), and other key renal sodium transporters by chronic insulin infusion in rats. Am J Physiol Renal Physiol. 2006, 290, F1055-1064.
- Stern PH & NH Bell: Effects of glucagon on serum calcium in the rat and on bone resorption in tissue culture. Endocrinology. 1970, 87, 111-117.
- US Food and Drug Administration: Guidance for industry. Diabetes Mellitus: developing drugs and therapeutic biologicals for treatment and prevention. 2008. https://www.fda.gov/downloads/Drugs/.../Guidances/ucm071624.pdf.
- Williams GA, EN Bowser, WJ Henderson: Mode of hypocalcemic action of glucagon in the rat. Endocrinology. 1969, 85, 538-541.
- Willing AE, EK Walls, HS Koopmans: Insulin infusion stimulates daily food intake and body weight gain in diabetic rats. Physiol Behav. 1990, 48, 893-898.