
Original scientific article
The effect of cage ventilation rate on the health of mice housed in
Individually Ventilated Cages
by Xiwei Wanga,b, Yuanyuan Zhanga, Taofeng Lua, Jiancheng Qic, Huairan Liua, Zhimin Jinb and Hongyan Chena,*
aHeilongjiang Provincial Key Laboratory of Laboratory
Animal and Comparative Medicine, State Key Laboratory of
Veterinary
Biotechnology, Harbin Veterinary Research Institute, Chinese Academy
of Agricultural Sciences, Harbin, China.
bCollege of Life Science and Technology, Mudanjiang
Normal University, Mudanjiang, China.
cInstitute of Medical Equipment, Academy of Military
Medical Sciences, National Engineering Research Center f or
Biological
Protective Equipment, Tianjin, China.
 Correspondence: Hongyan Chen
Email: chenhongyan@caas.cn
Summary
The number of air changes per hour (ACH), an important index for individually ventilated cages (IVC), strongly affects the cage microenvironment and the health of laboratory animals. The objective of this study was to determine whether high or low cage ventilation adversely affects the health of mice housed in IVC systems and to identify cage ventilation rates suitable for the welfare of mice. We tested three different cage ventilation rates (40, 60, and 80 ACH) for 3 weeks in an IVC system. The temperature, relative humidity and ammonia concentrations in the cages were measured daily. The indices used to assess mouse health at specific time points throughout the study were body weight, stress hormones, T lymphocyte subsets (CD4 and CD8), immunoglobulins (IgG, IgM and IgA) and immune cells. There were no significant differences in body weight, growth hormones, immunoglobulin and T lymphocyte subsets in the IVC groups compared with the control group. The concentrations of corticosterone and epinephrine on day 7 of cage ventilation at 80 ACH were significantly higher than those in the control group (P < 0.05). Mice housed in 80 ACH cages had the lowest immune cell counts among all groups, and the numbers of lymphocytes and neutrophils were significantly lower than those in the control group (P < 0.05). In summary, cage ventilation at 60 ACH provided an optimum cage microenvironment for mouse health and welfare.
Introduction
Technological developments in recent decades have yielded a novel housing system for laboratory animals, called ‘Individually Ventilated Cages’ (IVCs). At present, IVCs are commonly and increasingly used. IVC systems have numerous benefits, including relatively low investment costs, easy operation and high degree of containment, which can protect animals against infections, substantially reduce exposure to laboratory animal allergens and improve the health of staff (Gordon et al. 2001; Myers et al. 2003; Schweitzer et al. 2003; Compton et al. 2004). In particular, through effective cage ventilation, IVC systems allow for a relatively healthy microenvironment for laboratory animals.
The number of air changes per hour (ACH), an important technical index
of IVC systems, substantially affects the cage microenvironment and
the health of laboratory animals. Compared with static (unventilated)
microisolator cages, IVC cages have lower ammonia, lower CO2, lower
humidity and higher O2 (Memarzadeh et al. 2004; Rosenbaum et al. 2010;
Nagamine et al. 2012). Cage air exchange can reduce the accumulation
of noxious gases, ensure the drying of bedding and provide a more
healthy and comfortable cage microenvironment. High concentrations of
ammonia and CO2 in cages can induce mouse stress responses and
physiological and hormonal changes, such as increased respiration and
elevated corticosterone, thus severely threatening animal health
(Krohn and Hansen 2000; Krohn et al. 2003).
A previous study has evaluated the effects on the cage
microenvironment of varying the ventilation rates from 30 to 100 ACH;
the authors concluded that 30 ACH is sufficient to maintain an
adequate microenvironment when bedding is changed weekly (Reeb et al.
1998). The authors performed further research to determine whether the
cage changing interval could be prolonged without adversely affecting
mouse health which was assessed on the basis of breeding performance,
weanling weight and growth, plasma corticosterone levels, immune
function and histological examination (Reeb-Whitaker et al. 2001).
Cage changes once every 14 days and a ventilation rate of 60 ACH were
found to provide the optimum conditions for animal health and
practical husbandry.
In addition, one study has shown that mice reject cages with a high
number of air changes (100 ACH), possibly because the high ventilation
rate induces a high air speed that may cause stress and discomfort
(Baumans et al. 2002). Another investigation of the effects of air
changes of 50, 80, and 120 ACH in rats has reported that the number of
air changes in each cage should be kept below 80 ACH to avoid
affecting rat physiological indexes (Krohn et al. 2003; Krohn and
Hansen 2010). Therefore, the cage ventilation rate is an important
factor affecting the physiology and behavior of laboratory animals,
and the validity and reproducibility of scientific data.
Although several studies have assessed cage microenvironmental
parameters under variable cage ventilation rates (Baumans et al. 2002;
Reeb et al. 1998; Reeb-Whitaker et al. 2001), few studies have
simultaneously and systematically examined the effects of cage
ventilation rate on the cage microenvironment, animal health status
and welfare. In this investigation, we sought to determine whether
high or low cage ventilation adversely affects the health of mice
housed in IVC systems and to identify cage ventilation rates suitable
for mouse health and welfare. In addition, we sought to understand
better the environment of laboratory mice and to provide a scientific
basis for the development of updated guidelines for animal health and
practical husbandry.
Materials & Methods
Animals and housing conditions
Female ICR mice (n=100; age, 6 weeks; weight, 24-28 g) were obtained
from a commercial vendor (ChangshengBio Corp, Benxi, Liaoning), and
randomly grouped and housed in polyphenylsulfone (28.5 cm × 15 cm ×
13.5 cm) cages within an IVC rack. According to the results of health
surveillance programs performed by the vendor and our research
institution, the mice were free of 15 viruses (mouse hepatitis virus,
mouse parvoviruses, reovirus, theiler’s mouse encephalomyelitis
virus, ectromelia virus, mouse rotavirus, thymic virus, pneumonia
virus of mice, sendai virus, murine cytomegalovirus, murine norovirus,
lymphocytic choriomeningitis virus, lactic dehydrogenase-elevating
virus, hantavirus, and mouse adenovirus), 17 bacterial species
(including Helicobacter spp), two Mycoplasma spp, mouse ectoparasites
and endoparasites, and encephalitozoon cuniculi. Female mice were
chosen because they have a lower potential for intra-cage aggression
than males; body injury due to aggression can affect hormone levels
and immune function.
The IVC system (HongtengBio Corp, Dongguan, Guangdong) was placed in a
laboratory animal barrier system, Harbin Veterinary Research
Institute, Chinese Academy of Agricultural Sciences. The animal room
directly collected outdoor air through high efficiency particulate
arresting (HEPA) filtration and was maintained at 15 ACH, 23 - 27 °C
and 30 - 70% relative humidity. The light cycle was 12 h light and 12
h dark. The cage air pressure was negative with respect to the room.
During the study, all cages were equipped with approximately 150 g of
autoclaved wood shaving bedding (Keao Corp, Beijing, China), water
bottles and Co60 sterilized feed (Keao Corp, Beijing, China). The
cages and bedding were changed every 7 d.
Experimental design
We studied three different cage ventilation rates (40, 60, and 80 ACH)
in three IVC systems of the same model. Each cage contained five mice,
and six cages were located within each rack. The experiment lasted 3
weeks. The environmental parameters analyzed in this study consisted
of daily ammonia levels, and the temperature and relative humidity in
the cages and the room. Indices used to assess the health of mice at
specific time points throughout the study were body weight, stress
hormones (corticosterone, growth hormone, and epinephrine), T
lymphocyte subsets (CD4 and CD8), immunoglobulins (IgG, IgM and IgA)
and immune cells. In addition, two open-top cages in the animal room
were used as a control. At the conclusion of the experiments, animals
were euthanized with carbon dioxide gas. All experimental procedures
were approved by IACUC of the Harbin Veterinary Research Institute,
Chinese Academy of Agricultural Sciences.
Cage microenvironment
The temperature and relative humidity in the cages were measured daily
with a combined temperature and humidity detection instrument
(TES-1360A Humidity/Temperature Meter, TES, Taibei, Taiwan). The
measurement accuracy of this device can range from ±3 %RH and ±0.8 °C.
For sampling, the device was quickly placed into cages after the lid
was opened and air was sampled for a minimum of 5 min, and the maximum
value was reported. The room was always measured first by sampling at
a height of 1 m in the center of the room for 5 minutes. Cage and room
ammonia levels were monitored daily with a pumping ammonia
concentration detector (CH100-NH3, Chuchuang, Jinan, Shandong). The
measurement accuracy of this device ranged from ±2 ppm, and the
maximum detectable concentration was 200 ppm. Ammonia concentrations
were measured using the same method as that for temperature and
humidity. After data were obtained, the cages were returned to the
ventilated rack. Both devices had been calibrated by professional
inspection institutions and were within the valid verification period.
Body weight
Mice were weighed at the same time on days 0, 7, 14, and 21. The same
electronic scale (PL203, Mettler toledd, Shanghai, China) was used to
weigh all mice over the course of the study.
Hormone levels
To assess the response of the sympathetic nervous system to different
cage ventilation rates, we measured three stress-related hormones in
the mice: epinephrine, corticosterone and growth hormone. Blood was
sampled between 08:30 and 10:00 h before cage change on the last day
of each week. According to a method described by Golde et al. (2005),
0.5ml blood samples were obtained by an experienced technician from
the submandibular vein without anesthesia, to reduce animal stress and
avoid fluctuations in hormones during sample collection. Serum samples
were measured according to the protocol provided by the manufacturer
of the enzyme linked immunosorbent assay kits (JianchengBio, Nanjing,
Jiangsu). The kits contained internal controls, and a standard curve
was calculated to determine sample values.
Immune function
To assess the long-term effects of cage ventilation rates on immune
function in mice, 0.2 mL blood samples were placed into EDTA
anticoagulation tubes on the last day of the experiment. An automated
blood physiological analysis system (BC-2800Vet, Mindray, Shenzhen,
Guangdong) was used to determine the number of monocytes, leukocytes,
neutrophils and lymphocytes. This test was performed immediately after
blood collection to ensure data accuracy. Another aliquot of the blood
samples was used to determine the concentration of immunoglobulins and
the T lymphocyte subset. Immunoglobulin is an important component of
the immune system, and its concentration reflects immune function to
some extent. Serum samples were measured according to the protocol
provided by the manufacturer of the enzyme linked immunosorbent assay
kits (LiankeBio, Hangzhou, Zhejiang). The kits contained internal
controls, and a standard curve was calculated to determine sample
values.
Statistical analysis
All statistical analysis was performed with IBM SPSS version 19.0 for
Windows, and values are presented as the mean ± SD. Statistical
significance was defined as a P value of less than 0.05. Temperature
and humidity data were analyzed by using a general linear mixed model
for repeated measures, with day as a within-cage factor and cage
ventilation rate as a between-cage factor. After goodness-of-fit
indices for several covariance models were compared, a first-order
autoregressive model was chosen to measure the within-cage covariance
over time. Ammonia levels, body weight, hormone levels, T lymphocyte
subset, immunoglobulins and immune cells were analyzed to determine
the statistical significance of the data according to the cage
ventilation rate group by using one-way ANOVA. A complete list of
variables measured, frequency of sampling and methodology used to
obtain the data is given in Table1.
Table 1. Measured variables, frequency of sampling and sampling methodologies
|
Measured variable |
Frequency |
Methodology |
Ammonia |
Daily |
Pumping ammonia concentration detector |
Temperature and humidity |
Daily |
TES-1360A Humidity/Temperature Meter |
Body weight |
Days 0, 7, 14, 21 |
0.1-g electronic scale |
Stress hormones |
Days 7, 14, 21 |
ELISA |
T lymphocyte subset |
Day 21 |
ELISA |
Immunoglobulin |
Day 21 |
ELISA |
Immune cell |
Day 21 |
Automated blood physiological analysis system |
Results
Temperature
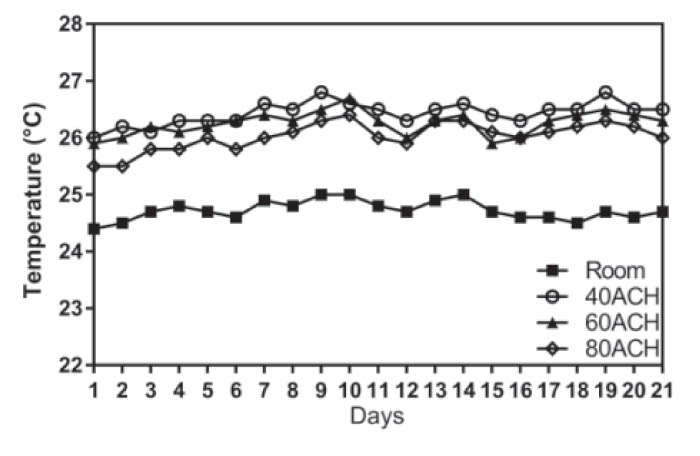
The temperature within cages was significantly associated with the
number of days and the cage ventilation rate (P < 0.001). There
were significant differences in temperature among the three cage
ventilation groups (P < 0.05). Across all days, the cage
temperature for all three ventilated groups was consistently
significantly higher than room temperature (P < 0.05), and the cage
temperature decreased with increasing cage ventilation (Figure 1).
|
|
Figure 1. Temperature (°C) of each ACH group
and room, daily during 21 days. Each line represents the average
value of the 6 cages in each ACH group. Click image to enlarge |
Humidity
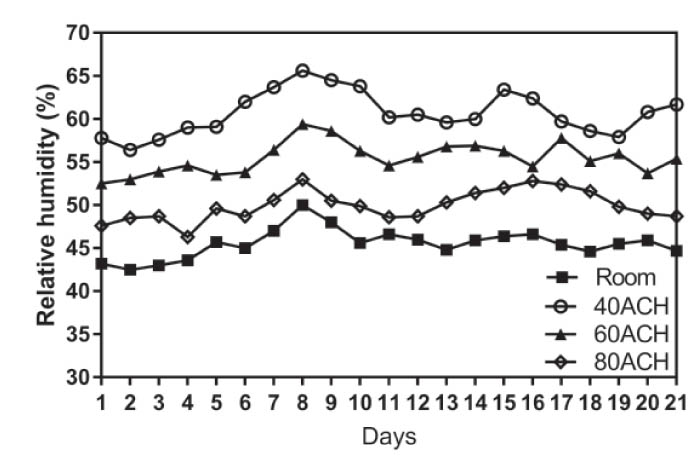
The relative humidity within cages was significantly associated with
the number of days and the cage ventilation rate (P < 0.001). There
were significant differences in relative humidity among the three cage
ventilation groups (P < 0.05). Across all days, the relative
humidity within cages for all three groups was consistently
significantly higher than the room levels (P < 0.05), and the cage
relative humidity decreased with increasing cage ventilation (Figure
2).
|
|
Figure 2. Relative humidity (%) of each ACH
group and room, daily during 21 days. Each line represents the
average value of the 6 cages in each ACH group. Click image to enlarge |
Ammonia
The room ammonia levels were 0 ppm for all sampling days. The cages
showed a detectable increase in ammonia on day 3, and the ammonia
concentrations steadily increased thereafter until the time of the
cage change on day 7 (Figure 3). The highest average level of ammonia
within cages was recorded on day 7 in the 40 ACH group (approximately
22 ppm), and the ammonia levels within cages decreased with increasing
cage ventilation rates. The average ammonia levels on day 6 and 7
showed significant differences among the three cage ventilation groups
(P < 0.05), and the average ammonia level on day 5 in the 40 ACH
group was significantly higher than that in the 60 and 80 ACH groups
(P < 0.05).
|
|
Figure 3. Ammonia concentrations for various
ventilation rate groups after cage change. Each line represents
the average value for 3 weeks measured for 6 cages per group. Click image to enlarge |

Body weight
Weight loss due to chronic stress was not observed in any mice.
Average body weight gains from day 0 to day 21 were as follows:
control 8.38±1.15 g, 40 ACH 8.06±0.89 g, 60 ACH 8.90±1.85 g, and 80
ACH 7.88±1.33 g. No significant differences in weight gain were found
across the groups, and cage ventilation did not significantly affect
weight gain. The weight gain at 80 ACH was lower than that at other
cage ventilation levels, although the result was not statistically
significant.
Hormone levels
The corticosterone levels under cage ventilation at 40 ACH and 60 ACH
were not significantly different from those of the control group at
any time point, whereas the level on day 7 under 80 ACH was
significantly higher than that of the control group (P < 0 .05). No
statistically significant trends were detected in corticosterone
concentration over time in each ACH group (Figure 4).
|
|
Figure 4. Corticosterone levels at 7, 14 and
21 days in each ACH group. An asterisk above a column denotes a
statistically significant difference compared with the control
(P < 0 .05). Click image to enlarge |

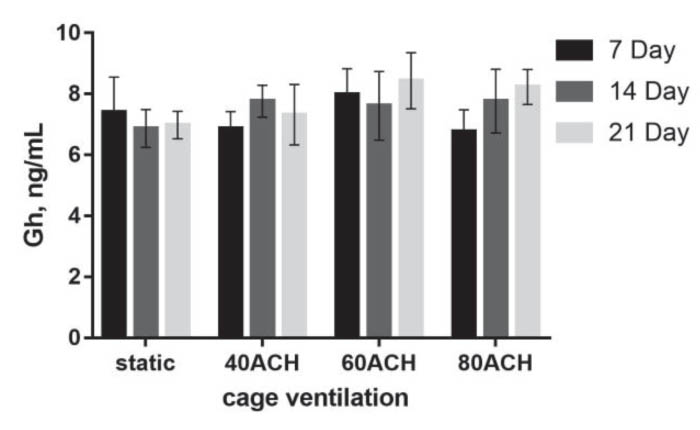
Significant differences were not detected for growth hormone at any time point, and no statistically significant trends were detected in growth hormone concentration over time in each ACH group (Figure 5).
|
|
Figure 5. Growth hormone levels at 7, 14 and
21 days in each ACH group. Click image to enlarge |
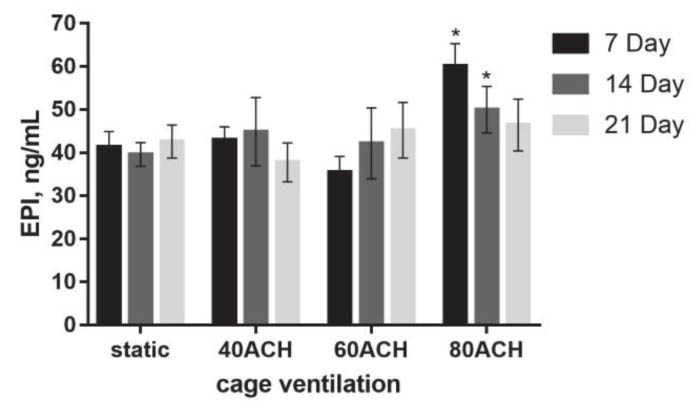
The epinephrine levels under cage ventilation at 40 ACH and 60 ACH
were not significantly different from those of the control group at
any time point, whereas the levels on days 7 and 14 under 80 ACH were
significantly higher than those of the control group (P < 0 .05).
No statistically significant trends were detected in epinephrine
concentration over time in each ACH group, but the epinephrine
concentration at 80 ACH tended to decrease over time (Figure 6).
|
|
Figure 6. Epinephrine levels at 7, 14 and 21
days in each ACH group. An asterisk above a column denotes a
statistically significant difference compared with the control
(P < 0 .05). Click image to enlarge |
Immune function
The results from the enzyme linked immunosorbent assays showed no
significant differences in immunoglobulins and T lymphocyte subset
among the ACH groups (Table 2). As shown in Table 3, mice housed in 80
ACH cages had the lowest immune cell counts, and the numbers of
lymphocytes and neutrophils were significantly lower than those in the
control group (P < 0.05). No significant differences were detected
in the other ACH groups.
Table 2. The effect of cage ventilation rate on measured immune function
|
|
Cage ventilation rate |
||
|
Immune indices |
Control |
40 ACH |
60 ACH |
80 ACH |
IgA (ng/ml) |
64.81 ± 4.38 |
65.07 ± 6.97 |
67.80 ± 5.65 |
64.27 ± 8.95 |
IgG (ng/ml) |
553.42 ± 79.58 |
550.59 ± 78.61 |
527.23 ± 67.81 |
485.39 ± 51.69 |
IgM (ng/ml) |
3.91 ± 1.03 |
4.28 ± 0.79 |
3.43 ± 1.64 |
3.25 ± 1.40 |
CD4 (U/ml) |
12.68 ± 1.15 |
13.46 ± 1.07 |
13.12 ± 1.14 |
13.58 ± 1.40 |
CD8 (U/ml) |
112.41 ± 8.98 |
114.24 ± 4.67 |
111.22 ± 10.47 |
114.35 ± 11.90 |
CD4 positive cells, T helper cells; CD8 positive cells, cytotoxic T cells.
Table 3. The effect of cage ventilation rate on measured immune cells
|
|
Cage ventilation rate |
||
|
Cell types(×109/L) |
Control |
40 ACH |
60 ACH |
80 ACH |
Leukocytes |
5.76 ± 0.99 |
4.82 ± 0.84 |
5.47 ± 0.80 |
4.45 ± 1.15 |
Lymphocytes |
4.08 ± 0.74 |
4.58 ± 1.23 |
4.56 ± 0.86 |
2.62 ± 0.62* |
Monocytes |
0.27 ± 0.14 |
0.20 ± 0.13 |
0.22 ± 0.04 |
0.18 ± 0.08 |
Neutrophils |
1.35 ± 0.39 |
1.18 ± 0.45 |
1.62 ± 0.26 |
0.83 ± 0.35* |
*Value is significantly different from control (P < 0.05).
Discussion
Housing systems can have significant effects on laboratory animal physiology and behavior, two aspects closely related to mouse welfare. IVC systems can maintain higher air quality in the cage environment through effective ventilation rate. However, different cage ventilation rates have varying effects on the environment within cages. In this study, a systematic simultaneous examination of cage microenvironment, health status and welfare relative to the cage ventilation rate was performed to determine whether high or low air exchange might compromise the well-being of mice and to identify cage ventilation rates suitable for mouse welfare.
The temperatures measured in this study remained within the boundaries
suggested in the guide for European laboratory-housed mice. In
agreement with results from previous studies (Spangenberg et al.
2014), the ventilated cage temperature remained higher than the room
temperature, perhaps because the lids of the IVC were closed. There
were significant differences in temperature among the three cage
ventilation groups. Although the temperature within cages differed
only slightly between the test groups, the effects of temperature on
mouse health cannot be ignored. A study has shown that as ambient
temperature decreases, the mean blood pressure, heart rate and pulse
pressure significantly increase in mice and rats, and mice have
greater sensitivity to these temperatures changes (Swoap et al. 2004).
According to current guidelines, the relative humidity of the
microenvironment for rodents should remain within 30-70%; levels above
or below this range may increase preweaning mortality in mice (Clough
1982). Throughout this study, the relative humidity in the room and in
cages remained within this recommended range. There were significant
differences in relative humidity among the cages in the three
ventilation groups, and cages at 80 ACH had the lowest humidity
levels. This result suggests that a higher cage ventilation rate
removes excess moisture from cages. Furthermore, the room ventilation
rate also affects the humidity in cages, which has been found to
significantly decrease from 55% relative humidity at 5 ACH to 36%
relative humidity at 20 ACH (Reeb et al 1997). Another study has
compared the cage microenvironment under room ventilation rates of 5
to 6 ACH versus 10 to 12 ACH and has concluded that higher room
ventilation rates provide a comfortable housing environment for mice
(Geertsema et al. 2015). The most important reason for controlling
relative humidity inside the cage is that excessive moisture enhances
the proliferation of urease-positive bacteria and increases ammonia
production (Memarzadeh 2005). A relative humidity substantially
significantly exceeding 35% dramatically increases ammonia generation
rates in static mouse caging (Freymann et al. 2015). A study
evaluating two levels of relative humidity (35% and 75%) within mouse
cages has found that lower humidity results in lower generation of
ammonia (Perkins and Lipman 1996).
At room temperature, ammonia is a colorless gas with a distinctive
pungent odor, and it is a severe irritant to the respiratory tract,
skin and mucous membranes (Perkins and Lipman 1995). Ammonia is
produced by the conversion of urea by urease, which may be present in
bedding or produced by fecal bacteria (Freymann et al. 2015). Studies
have demonstrated that prolonged exposure to high ammonia
concentrations can cause histologic changes in the respiratory tract
and promote the growth of pathogenic bacteria; in addition, rats
exhibit better reproductive performance and a lower incidence of
pneumonia at lower ammonia levels (Höglund and Renström 2001; Teixeira
et al. 2006).
In our study, the cages showed a detectable increase in ammonia on day
3, and the ammonia concentrations steadily increased thereafter until
the cage change on day 7. After the cage change, ammonia returned to
very low levels. These findings of cyclical fluctuations are consistent
with results from previous studies (Silverman et al. 2009; Mexas et
al. 2015; Eichner et al. 2017). The 40 ACH cages had the highest
levels of ammonia, which may cause discomfort and stress in mice, and
adversely affect mouse health. The 80 ACH cages had the lowest ammonia
levels, thus suggesting that higher air exchange rates effectively
decrease ammonia concentration in cages.
In addition to the factors discussed in this study, the cage change
frequency, the amount and type of bedding and animal density can
affect ammonia levels in cages (Gordon 2004; Smith et al. 2004).
Prolonging the cage change frequency may lead to bacterial
proliferation and increased ammonia concentrations (Allison et al.
2011). One study has evaluated the effects of three bedding volumes
(low, medium and high) on cage microenvironment and mouse health, and
has concluded that low bedding volume is associated with higher
ammonia and humidity levels (Rosenbaum et al. 2009). High housing
densities may adversely affect animal health, for example, by
compromising air quality inside the cage (Divincenti et al. 2012).
Although exposure to ammonia may influence rodent health, precise
exposure data and tolerable ranges are unknown (Silverman et al.
2008). There are no specific guidelines for the maximum ammonia
concentration to which mice can be exposed, probably because the
ammonia levels that are harmful are unclear, and human exposure
standards may not be applicable to mice. In addition, research has
shown that mice can cope with high ammonia concentrations within
cages, and different strains of mice differ widely in their tolerance
of relatively high ammonia levels (Gordon 2004; Green et al. 2008).
Therefore, more research on the effects of ammonia on mice is
necessary to better understand what ammonia concentrations may be
harmful to mice.
Body weight is an important metric commonly used in animal
experiments, as a nonspecific indicator of mouse health. Decreases in
body weight may indicate that mice are stressed or that their health
is impaired by a detrimental housing environment. In the current
study, significant differences in body weight were not detected across
the different ACH groups; weight gain at 80 ACH was lower than that at
other cage ventilation rates, although the result was not
statistically significant. This result may suggest that excessive cage
ventilation negatively affects weight gain in mice.
Poor housing systems can cause stress to laboratory animals, affect
physiological systems, and perturb biochemical stability. When animals
are stressed, the hypothalamic–pituitary–adrenocortical axis and the
sympatho-adrenomedullary system, which both have a key role in
hormonal reactions to stress, are activated (Broom 1986). Adverse
situations trigger responses of the adrenals, which result in an
increase in glucocorticoid and/or catecholamine secretion (Moberg
2000). These increases are the front-line endocrine mechanisms to
defend the organism against stressful situations (Mostl and Palme
2002). Corticosterone levels have been widely used as a
physiological parameter reflecting animal health and welfare, and they
represent the degree of damage to the body caused by chronic stress to
some extent (Mostl and Palme 2002; Godfrey & Silverman 2009). In
the current study, epinephrine levels on days 7 and 14 under 80 ACH
were significantly higher than those of the control group, and the
corticosterone level on day 7 under 80 ACH was significantly higher
than that of the control group. The reason for these observations
might be that the IVC with cage ventilation at 80 ACH produced more
rapid air speeds in cages, which caused a stress response and
adversely affected mouse health. Growth hormone is also associated
with the stress response, one study has shown that acute stress
decreases the secretion of growth hormone in the peripheral blood of
adult rats; this effect is caused by the secretion of CRF
(corticotropin-releasing hormone) from the hypothalamus, thus
increasing somatostatin secretion (Eck and Kuhn 1992). In our study,
growth hormone concentration was not significantly decreased at any
time in each group.
In summary, our investigation demonstrated that cage ventilation at 60
ACH provided an optimum cage microenvironment for mouse health and
welfare. The setting at 40 ACH was the lowest possible in the IVC
system used in this experiment and is not the recommended because it
cannot maintain a healthy cage microenvironment. A setting at 60 ACH
may allow for a balance between maintaining high quality air in cages
and not disturbing mouse health. When 80 ACH was set in the IVC
system, the high air speed caused discomfort in the mice and affected
their physiology. Because of the differences in cage system design,
microenvironment conditions and animal health status, the results
reported here may differ from those for other IVC systems. Therefore,
further studies are necessary to better understand the relationships
among cage ventilation rate, cage microenvironment and mouse health.
Acknowledgements
This work was supported by the National Key R&D Program (2016YFC1201401). We thank Wang Zi, Chu Jian and Jiannan Lv for assisting in sample collection and daily maintenance.
References
- Allison, S.O., Criley, J.M., Kim, J.Y. & Goodly, L.J., (2011). Cage Change Intervals for Opossums (Monodelphis domestica) in Individually Ventilated Cages. The Journal of the American Association for Laboratory Animal Science. 50, 647-652.
- Baumans, V., Schlingmann, F., Vonck, M., van Lith, H.A., (2002). Individually ventilated cages: beneficial for mice and men? Contemporary Topics in Laboratory Animal Science. 41, 13-19.
- Broom, D. M., (1986). Indicators of poor welfare. British Veterinary Journal. 142, 524-526.
- Clough, G., (1982). Environmental effects on animals used in biomedical research. Biological Reviews of the Cambridge Philosophical Society. 57, 487-523.
- Compton, S.R., Homberger, F.R., Paturzo, F.X., Clark, J.M., (2004). Efficacy of three microbiological monitoring methods in a ventilated cage rack. Comparative Medicine. 54, 382-392.
- DiVincenti, L., Moorman-White, D., Bavlov, N., Garne, M., Wyatt, J., (2012). Effects of housing density on nasal pathology of breeding mice housed in individually ventilated cages. Lab Animal (NY). 41, 68-76.
- Eck, J.B., Kuhn, C.M., (1992). Effect of ether stress on growth hormone during development in the neonatal rat. Neuroendocrinology. 56, 605-610.
- Eichner, M., Purcell, J.E., Fortman, J.D., (2017). Effects of Intracage Ammonia on Markers of Pulmonary Endothelial Integrity in Mice Housed in Static Microisolation Cages. The Journal of the American Association for Laboratory Animal Science. 57, 18-23.
- Freymann, J., Tsai, P.P., Stelzer, H., Hackbarth, H, (2015). The amount of cage bedding preferred by female BALB/c and C57BL/6 mice. Lab Animal (NY). 44, 17-22.
- Godfrey, D., Silverman, J, (2009). Effects of a fire alarm strobe light on fecal corticosterone metabolite concentrations in mice. Lab Animal (NY). 38, 61-68.
- Green, A.R., Wathes, C.M., Demmers, T.G., Clark, J.M., Xin, H., (2008). Development and application of a novel environmental preference chamber for assessing responses of laboratory mice to atmospheric ammonia. The Journal of the American Association for Laboratory Animal Science. 47, 49-56.
- Höglund, A.U., Renström, A, (2001). Evaluation of individually ventilated cage systems for laboratory rodents: cage environment and animal health aspects. Laboratory Animals. 35, 51-57.
- Geertsema, R.S., Lindsell, C.E., (2015). Effect of Room Ventilation Rates in Rodent Rooms with Direct-Exhaust IVC Systems. The Journal of the American Association for Laboratory Animal Science. 54, 521-526.
- Golde, W.T., Gollobin, P., Rodriguez, L.L., (2005). A rapid, simple, and humane method for submandibular bleeding of mice using a lancet. Lab Animal (NY). 34, 39-43.
- Gordon, S., Fisher, S.W. & Raymond, R.H., (2001). Elimination of mouse allergens in the working environment: assessment of individually ventilated cage systems and ventilated cabinets in the containment of mouse allergens. The Journal of Allergy and Clinical Immunology. 108, 288-294.
- Gordon, C.J., (2004). Effect of cage bedding on temperature regulation and metabolism of group-housed female mice. Comparative Medicine. 54, 63-68.
-
Krohn, T.C., Hansen, A.K., (2000). The effects of and tolerances for
carbon dioxide in relation to recent developments in laboratory
animal housing.
Scandinavian Journal of Laboratory Animal Science.
27, 173-181.
Krohn, T.C., Hansen, A.K., Dragsted, N., (2003). The impact of cage ventilation on rats housed in IVC systems. Laboratory Animals. 37, 85-93. - Krohn, T.C., Hansen, A.K., Dragsted, N., (2003). The impact of low levels of carbon dioxide on rats. Laboratory Animals. 37, 94-99.
- Krohn, T.C., Hansen, A.K., (2010). Mice prefer draught-free housing. Laboratory Animals. 44, 370-372.
- Memarzadeh, F., Harrison, P.C., Riskowski, G.L., Henze, T., (2004). Comparison of environment and mice in static andmechanically ventilated isolator cages with different air velocities and ventilation designs. Contemporary topics in laboratory animal science. 43, 14-20.
- Memarzadeh, F., (2005). Control of Ammonia Production in Animal Research Facilities Through Ventilation System Design. Ashrae. Transactions. 111, 4246-4254.
- Mexas, A.M., Brice, A.K., Caro, A.C., Hillanbrand, T.S., Gaertner, D.J., (2015). Nasal histopathology and intracage ammonia levels in female groups and breeding mice housed in static isolation cages. The Journal of the American Association for Laboratory Animal Science. 54, 478-486.
- Moberg G P., (2000). Biological response to stress: implications for animal welfare. CABI Pubhshing, pp. 1-21.
- Mostl, E., Palme, R., (2002). Hormones as indicators of stress. Domestic Animal Endocrinology. 23, 67-74.
- Myers, D.D., Smith, E., Schweitzer, I., Stockwell, J.D., Paigen, B.J., Bates, R., Palmer, J., Smith, A.L., (2003). Assessing the risk of transmission of three infectious agents among mice housed in a negatively pressurized caging system. Contemporary topics in laboratory animal science. 42, 16-21.
- Nagamine, C.M., Long, C.T., McKeon, G.P., Felt, S.A., (2012). Carbon dioxide and oxygen levels in disposable individually ventilated cages after removal from mechanical ventilation. The Journal of the American Association for Laboratory Animal Science. 51, 155-161.
- Perkins, S.E., Lipman, N.S., (1995). Characterization and quantification of microenvironmental contaminants in isolator cages with a variety of contact beddings. Contemporary topics in laboratory animal science. 34, 93-98.
- Perkins, S.E., Lipman, N.S., (1996). Evaluation of microenvironmental conditions and noise generation in three individually ventilated rodent caging systems and static isolator cages. Contemporary topics in laboratory animal science. 35, 61-65.
- Reeb, C.K., Jones, R.B., Bearg, D.W., Bedigian, H., Paigen, B., (1997). Impact of Room Ventilation Rates on Mouse Cage Ventilation and Microenvironment. Contemporary topics in laboratory animal science. 36, 74-79.
- Reeb, C., Jones, R., Bearg, D., Bedigan, H., Myers, D., Paigen, B., (1998). Microenvironment in ventilated animal cages with differing ventilation rates, mice populations, and frequency of bedding changes. Contemporary topics in laboratory animal science. 37, 43-49.
- Reeb-Whitaker, C.K., Paigen, B., Beamer, W.G., Bronson, R.T., Churchill, G.A., Schweitzer, I.B., Myers, D.D., (2001). The impact of reduced frequency of cage changes on the health of mice housed in ventilated cages. Laboratory Animals. 35, 58-73.
- Riskowski, G.L., Harrison, P.C., Memarzadeh, F., (2006). Mass Generation Rates of Ammonia, Moisture, and Heat Production in Mouse Cages with Two Bedding Types, Two Mouse Strains, and Two Room Relative Humidities. ASHRAE Transactions. 112, 134-144.
-
Rosenbaum, M.D., VandeWoude, S., Johnson, T.E., (2009). Effects of
cage-change frequency and bedding volume on mice and their
microenvironment.
The Journal of the American Association for Laboratory Animal
Science. 48, 763-773.
Rosenbaum, M.D., Vandewoude, S., Volckens, J., Johnson, T., (2010). Disparities in ammonia, temperature, humidity and airborne particulate matter between the micro- and macroenvironments of mice in individually ventilated caging. The Journal of the American Association for Laboratory Animal Science. 49, 177-183. - Schweitzer, I.B., Smith, E., Harrison, D.J., Myers, D.D., Eggleston, P.A., Stockwell, J.D., Paigen, B., Smith, A.L., (2003). Reducing exposure to laboratory animal allergens Comparative Medicine. 53, 487-492.
- Smith, A.L., Mabus, S.L., Stockwell, J.D., Muir, C., (2004). Effects of housing density and cage floor space on C57BL/6J mice. Comparative Medicine. 54, 656-663.
- Smith, E., Stockwell, J.D., Schweitzer, I., Langley, S.H., Smith, A.L., (2004). Evaluation of cage microenvironment of mice housed on various types of bedding materials. Contemporary topics in laboratory animal science. 43, 12-17.
- Silverman, J., Bays, D.W., Cooper, S.F., Baker, S.P., (2008). Ammonia and carbon dioxide concentrations in disposable and reusable ventilated mouse cages. The Journal of the American Association for Laboratory Animal Science. 47, 57-62.
- Silverman, J., Bays, D.W., Baker, S.P., (2009) Ammonia and carbon dioxide concentrations in disposable and reusable static mouse cages. Lab Animal (NY).2009, 38, 16-23.
- Spangenberg, E., Wallenbeck, A., Eklöf, A.C., Carlstedtduke, J., Tjäder, S., (2014). Housing breeding mice in three different IVC systems: maternal performance and pup development. Laboratory Animals. 48, 193-206.
- Swoap, S.J., Overton, J.M., Garber, G., (2004). Effect of ambient temperature on cardiovascular parameters in rats and mice: a comparative approach. American Journal of Physiology - Regulatory, Integrative and Comparative Physiology. 287, R391-R396.
- Teixeira, M.A., Chaguri, L.C., Carissimi, A.S., Souza, N.L., Mori, C.M., Saldiva, P.H., (2006). Effects of an individually ventilated cage system on the airway integrity of rats (Rattus norvegicus) in a laboratory in Brazil. Laboratory Animals. 40, 419-431.