
Original scientific article
Failure to replicate? Exacerbated 8-OH-DPAT-induced hypothermia could not be established in single housed mice when tested as part of a battery of depression tests
by Skriver HW1,†, Kjær MR1,†, Sørensen DB2, Kalliokoski O1,*
1)Department of Experimental Medicine, Faculty of Health
and Medical Sciences, University of Copenhagen, Denmark
2)Department of Veterinary and Animal Sciences, Faculty
of Health and Medical Sciences, University of Copenhagen, Denmark
†These authors contributed equally to the study
 Correspondence: Otto Kalliokoski
Department of Experimental Medicine
Blegdamsvej 3B (Panum building, office 16.3.38a)
DK-2200, Copenhagen N
Tel. +45 35 32 70 12
Email: ohk@sund.ku.dk
Summary
We have previously described a depressive phenotype in male mice stemming from three weeks’ single housing, demonstrated as an exacerbated transient hypothermia following a challenge with the serotonin (5-HT) receptor agonist 8-OH-DPAT. In an attempt to flesh out the phenotype, we carried out a battery of tests used to assess depressive states on C57BL/6 mice of both sexes. When combining the 8-OH-DPAT challenge with the tail-suspension test, an open field test, a sucrose preference test, and blood samplings for measuring serum levels of oxytocin, we could find no clear evidence of depressive states in the single housed animals. The fact that we could not replicate our previous findings is puzzling; however, we suspect that the stressful nature of the test battery may have been detrimental to the model. These negative findings and their implications may prove of significant importance moving forward with studying natural models of depression.
Introduction
Despite being common practice in many laboratory animal facilities, the consequences of housing mice alone in shoebox cages is a divisive subject. Are there detrimental effects to a mouse’s wellbeing from its lack of contact with conspecifics? Is its welfare compromised? Does research carried out in single housed mice produce significantly different results than the same research on group housed mice? The current EU directive (2010) dictates that social animals must be housed in groups; but is an adult mouse even to be considered a social animal? Is it not completely unnatural to house adult male mice together? And so the debate rages on. A number of investigations have been carried out attempting to substantiate the arguments empirically, but the results, to date, have been as varied as the viewpoints. Whereas some studies find clear changes in behavior and physiology of single housed mice, other studies find no differences when comparing to group housed mice. An increased metabolic rate has been noted across multiple studies (Schipper et al. 2018; Späni et al. 2003), suggested to stem from not only lack of opportunities to socially thermoregulate, but also from emotional stress. The latter is further reinforced by multiple research groups noting behavior consistent with increased anxiety in single housed mice (e.g. Ferrari et al. 1998; Heredia et al. 2012; Voikar et al. 2005). This effect, seen across multiple strains, seems to be inconsistent and somewhat specific to the test that is employed. Ferrari et al. (1998) for example noted increased anxiety when testing single housed mice in the elevated plus maze, whereas Voikar et al. (2005) noted the opposite effect. The latter study did however note increased anxiety-like behavior in e.g. the light-dark box paradigm, conceptually corroborating the findings of Ferrari et al., even though they did not reproduce the exact findings. Moreover, Voikar et al. (2005) found evidence of impaired learning in spatial memory tests in single housed mice. Exacerbated memory impairments have also been noted in mice genetically engineered to mimic components of human Alzheimer’s disease when they are housed alone (Huang et al. 2011). Published studies thus paint vague patterns suggestive of neurobehavioral changes brought about in socially isolated mice. Finally, in choice-based testing, mice will choose the company of a conspecific over e.g. nesting material (van Loo et al. 2004). Even male mice will voluntarily choose the company of a potentially abusive dominant male mouse over isolation when offered the choice (van Loo et al. 2001). The inability to consistently demonstrate a difference between single and group housed mice in tests of purported anxiety (e.g. Bartolomucci et al. 2009) complicates the picture, however. The fact that no differences can be found in acute stress parameters, such as glucocorticoid levels, has furthermore been used as evidence that mice do not suffer from being socially isolated (e.g. Hunt and Hambly 2006; Arndt et al. 2009).
An argument can be made that the problem with studying single housing
is that no two single housing conditions are quite alike. Analogous to
the standardization fallacy (Würbel 2000), the more one reduces the
components of an experiment, the more ambient parameters – that which
remains – influence the results of one’s study, creating
idiosyncratic results that do not translate well between laboratories
(Richter et al. 2009). When studying single housing, we reduce our
experimental setup to as simple as is possible within an
in vivo science context: cages and different groupings of
mice. Add to this subtle effects, requiring large numbers of animals
in a sparsely funded field-of-study where costly studies seldom are an
option. Varied results should thus not come as a surprise; they are to
be expected. With meta-analytical pooling of data gaining momentum in
the laboratory animal science community (Hooijmans and
Ritskes-Hoitinga 2013; Avey et al. 2015) we may however overcome the
problems of idiosyncratic results and under-powered studies. The key
to addressing questions such as “do mice suffer from being
housed alone” using a meta-analytical approach is however for
all laboratories to report all of their findings, also when negative
(Rosenthal 1979; Thornton and Lee 2000). It is in this vein we share
the present report.
We have previously demonstrated an alarming effect on the serotonergic
system of single housed male mice (Kalliokoski et al. 2014); a
possible confounder of neurobiological investigations. Single housing
for three weeks appeared to alter the reactivity of the mice’s
serotonergic system to an exogenous agonist when compared to group
housed controls. A similar neurochemical change – an increased
excitability of 5-HT1A receptors – in humans is strongly associated
with depressions (Savitz et al. 2009; Parsey et al. 2006). We have
thus posited that our findings stem from a subtle depressive state,
brought on by even a shorter duration of solitary housing and possibly
the lack of stimulation in individually ventilated cages (the latter
potentially act as sensory deprivation chambers, preventing mice from
seeing, smelling and hearing their cage’s surrounding
environment). In order to better characterize the phenotype, we set
out to combine our previous experiment with a battery of other common
tests for characterizing depressive phenotypes; utilizing the
hypothermic response to a challenge with the serotonin receptor
agonist 8-OH-DPAT alone as a proxy of depressive affectedness can be
construed as too abstract a measure. Our goal was consequently to
better characterize the underlying phenotype, to find measures that
were correlated with the exacerbated hypothermic response to 8-OH-DPAT
following single housing, and measures that were not.
For our test battery we chose to investigate changes in sucrose
preference, suggestive of anhedonia (Monleon et al. 1995), the
immobility in a tail-suspension test (TST), suggestive of behavioral
despair (Steru et al. 1985), and our previously validated method of
measuring the hypothermic response to the serotonin receptor agonist
8-OH-DPAT, suggestive of increased 5-HT1A activity (Bert et al. 2006).
The sucrose preference test (SPT) and the TST have previously shown
some promise in detecting depressive changes in isolated mice (e.g.
D’Andrea et al. 2010; Martin and Brown 2010). In addition, we
included an open field test to measure general activity level, which
can be a confounder in the tail-suspension test (Steru et al. 1985;
Peng et al. 2007), and to measure serum levels of oxytocin. The latter
was included to investigate whether the depressive phenotype was
correlated with, or possibly modulated by, decreased oxytocin levels
brought on by decreased social stimulation and contact.
Materials & Methods
Animals and housing
A total of 48 six-weeks-old C57BL/6JRj mice of both sexes (n = 24/sex)
were acclimatized for a week after arriving from a commercial breeder
(Janvier Labs, Le Genest-Saint-Isle, France). The animals were housed
in groups of three in individually ventilated polycarbonate cages
(“1290D001”; Tecniplast, Buggugiate, Italy). Diurnal
rhythm was maintained with a 12:12 hour light-dark cycle with 30
minutes of twilight at transitions and lights on at 6 a.m. The ambient
temperature was kept at 19-23 °C, humidity at 42-46 % and cages were
set to be ventilated at a rate of 75 h-1 air changes. Post-experiment,
it was uncovered that the air-handling unit serving the cages in
question had suffered a failure and ventilation rates had fallen to 63
h-1 on cage level, suggesting that the ventilation rate may have been
somewhat lower than expected. Cages were changed every 14 days and the
positions on the racks were changed frequently to eliminate any bias
from cage position. Cages were lined with aspen chips (Tapvei,
Kortteinen, Finland) with wooden gnawing sticks (Tapvei) intermixed,
and shelters – red tinted translucent plastic shelters
(“JAKO”; Molytex, Glostrup, Denmark) and cardboard tubes
(Lillico, Horley, UK) – and nesting material (“Happi-mat”
nestlets; Scanbur, Karlslunde, Denmark) were supplied and replaced as
needed. Extruded feed (“Altromin 1314”; Brogaarden, Lynge,
Denmark) and tap water was provided ad libitum throughout the
study.
Single housing experiment
A week after arrival, baseline sucrose preference was established and
twelve days post-arrival (Day 0 of the experiment) a baseline blood
sample was obtained. Following the sampling, randomly selected
(randomized on cage-level) mice of both sexes were single-housed. Body
weights of the animals were recorded weekly throughout the study.
After three weeks of single housing, a battery of tests were carried
out, and on Day 28, following the (HIH) challenge, the animals were
euthanized by cervical dislocation (for an illustrated overview of the
experimental timeline, refer to Figure 1).
|
|
Figure 1. Timeline of the experiment. All
dates are reported relative to the initiation of single housing.
Group housed animals acting as negative controls were maintained
group housed (in the same groups) throughout the study. Weekly
recordings of body weights have been omitted from the timeline.
SPT: Sucrose preference test; OFT: Open field test; TST:
Tail-suspension test; HIH: Hydroxytryptamine-induced
hypothermia. Click image to enlarge |

The group sizes in the study were determined using simplistic power calculations (Cohen, 1988) based on historical data (Kalliokoski et al. 2013; Kalliokoski et al. 2014). The study was scaled to detect a difference of 5 % in the sucrose preference tests and an absolute difference of 1 °C in the HIH challenge tests, with α and β levels set at 0.05 and 0.2, respectively. The design originally included a re-housing phase, following the period of single housing. The original plan for the study was to induce a depressive state that we have seen in the past (Kalliokoski et al. 2014), and then to attempt to reverse this by socially housing a cohort of isolated mice. As a consequence, uneven experimental cohorts were employed from the start (as the single housed mice were to be further subdivided). The female mice – tested first – were housed in two groups of six animals, and eighteen animals were housed alone. Based on the (initial) null findings in the females, the study design was modified. The re-housing period was removed from the study and a follow-up experiment in male mice was instead undertaken, where 12 animals were housed in groups of 3, and 12 animals were single-housed.
Tests of depressive phenotype
Prior to all the outlined tests, with exception of the sucrose
preference tests, all animals were temporarily single-housed and
transported to an adjacent laboratory to ensure blinding of the
investigators. Testing orders were randomized for all of the tests.
Sucrose preference tests
The sucrose preference test (SPT) spanned 72 h and was initiated at 8
a.m. on Days -5 and 21 for baseline and endpoint measurements. In an
introduction phase, the mice were introduced to the SPT setup with two
water bottles mounted in the food hopper (feed pellets were moved to
the cage floor). Both bottles were filled with a 1.5 % (w/v) sucrose
solution. After 24 h, the bottles were substituted with one bottle
containing tap water and one bottle containing an 8 % (w/v) sucrose
solution (previously shown to be the preference maximum for C57BL/6
mice (Pothion et al. 2004)). The position of the sucrose-containing
bottle was randomized and after 24 h, the position of the bottles was
reversed in order to minimize the influence of place preference. The
intake of sucrose solution, expressed as a fraction of total fluid
intake, was recorded for a total of 48 h.
Open field tests
On Day 24, with testing initiated at 9 a.m., an open field test (OFT)
was carried out similarly to other investigations (Sáenz et al. 2006;
Valentinuzzi et al. 2000; Yoon et al. 2014). Briefly, a mouse was
placed in the corner of a square arena (45 × 45 cm, with 41 cm high
opaque walls) and allowed to freely explore its surroundings for ten
minutes (while the experimenters left the room). Activity was recorded
by a camera suspended 40 cm above the OFT apparatus and automatically
tracked in Ethovision XP (Noldus Information Technology, Wageningen,
the Netherlands) with distance travelled as the endpoint measurement.
Animals were acclimated to the testing laboratory for one hour prior
to testing. Lighting was kept low and the testing apparatus was
uniformly illuminated through only indirect lighting. The white OFT
arena ensured a good contrast with the animals’ fur color for
optimal automated tracking, and a painted grid (9 × 9 cm squares)
allowed for manual calculation of distance travelled through
line-crossings (used to verify accurate tracking by the software in
randomly chosen video recordings). The OFT arena was cleaned and wiped
down with 70 % ethanol between tests.
Tail-suspension tests
The tail-suspension test (TST) was carried out approximately 24 h
after the OFT, initiated at 9 a.m., and carried out according to Can
et al. (2012). Briefly, mice were suspended from a transverse bar in
an open testing box, 20-25 cm above the ground, using a piece of
masking tape attached 2-3 mm from the tail tip. A plastic cylinder was
threaded over the mouse’s tail prior to suspension, preventing
it from grabbing and holding on to its own tail once hanging; a common
problem with C57BL/6 mice (Mayorga and Lucki 2001). Two mice were
tested at a time in the TST apparatus; a solid divider prevented the
animals from seeing one another. A six-minute video recording was
obtained before the animals were returned to their home cages and the
apparatus was cleaned and wiped down with 70 % ethanol between tests.
Bouts of active struggling behavior were timed manually by two blinded
observers and the immobility time calculated.
HIH challenge
On the last day of the study (Day 28) the HIH challenge was conducted
similar to what we have described before (Kalliokoski et al. 2013;
Kalliokoski et al. 2014). Briefly, the mouse’s (baseline) rectal
temperature was recorded (“BAT-12” temperature probe;
Physitemp Instruments Inc., Clifton, NJ, USA) and a subcutaneous
injection of 40 µg 8-OH-DPAT
(R-(+)-8-hydroxy-2-(di-n-propylamino)-tetralin; Prod. No. H140;
Sigma-Aldrich, St. Louis, MO, USA), delivered in 100 µl sterile
isotonic saline, was deposited in the inguinal region. The animal was
subsequently placed in a barren cage, and 30 minutes post-injection
its rectal temperature was again recorded (corresponding roughly to
maximum hypothermia).
Oxytocin measurements
Tail vein blood samples were collected at 9 a.m. on Days 0 and 23. Briefly, animals were placed in a heated chamber (28-32 °C) for four minutes to ensure vasodilation, followed by placement in a restrainer. The tails were wiped down with 70 % ethanol, the lateral tail vein was punctured with a 25G hypodermic needle, and a 150 µl (approximately) blood sample was drawn. Serum was separated out through centrifugation (15 minutes at 1,600 g, 4 °C) and stored frozen (-70 °C) until analysis. Oxytocin content of the serum was determined using a commercial ELISA kit (“ADI-900-153”; Enzo Lifesciences, Farmingdale, NY, USA); analyses were carried out according to the manufacturer’s instructions.
Hypothesis testing
End of experiment measures were compared using independent samples
t-tests. Data were considered homoscedastic with the exception of the
sucrose preference where obvious differences in group variances were
noted. The SPT data were consequently tested using Welch’s
t-test for unequal variances. OFT data were not tested for
between-group differences, as the distance travelled is not considered
a variable related to depressive states in its own right. Instead, the
distance travelled was used as a proxy variable for an
individual’s general activity level. To ensure that a higher
activity level did not confound data from the TST, an ANCOVA model was
constructed for the immobility in the TST; housing was considered a
fixed effect, OFT distance travelled an explanatory covariate. For the
SPT data and serum oxytocin levels, where baseline data were obtained,
comparisons were made between baseline and end of experiment measures
using paired-samples t-tests. To verify that a housing effect was not
masked by individual differences at baseline, the oxytocin data were
also analyzed using a repeated-measures ANOVA testing for a time ×
housing interaction. Serum oxytocin levels appeared to conform to a
log-normal distribution (confirmed using Q-Q plots) and were
consequently log-transformed prior to all analyses. All tests were
carried out in IBM SPSS 24 (Armonk, NY, USA).
Ethics statement
The study was conducted in an AAALACi (Association for Assessment and
Accreditation of Laboratory Animal Care International) accredited
facility under the supervision of a local ethics committee. All
procedures were carried out in accordance with EU directive 2010/63/EU
and approved by the Animal Experiments Inspectorate under the Danish
Ministry of Food, Agriculture and Fisheries (license number
2016−15−0201−00991).
Statistical analysis
All statistical analysis was performed with IBM SPSS version 19.0 for
Windows, and values are presented as the mean ± SD. Statistical
significance was defined as a P value of less than 0.05. Temperature
and humidity data were analyzed by using a general linear mixed model
for repeated measures, with day as a within-cage factor and cage
ventilation rate as a between-cage factor. After goodness-of-fit
indices for several covariance models were compared, a first-order
autoregressive model was chosen to measure the within-cage covariance
over time. Ammonia levels, body weight, hormone levels, T lymphocyte
subset, immunoglobulins and immune cells were analyzed to determine
the statistical significance of the data according to the cage
ventilation rate group by using one-way ANOVA. A complete list of
variables measured, frequency of sampling and methodology used to
obtain the data is given in Table1.
Results
|
|
Figure 2. Body weight development in female
and male mice over three weeks of differential housing. Data is
displayed as means ± SD. Animals were weighed on the same day
but data points have been slightly shifted along the x-axis to
prevent overlapping error bars. Single housed animals did not
differ in body weight from their group housed counterparts
throughout the study. Click image to enlarge |

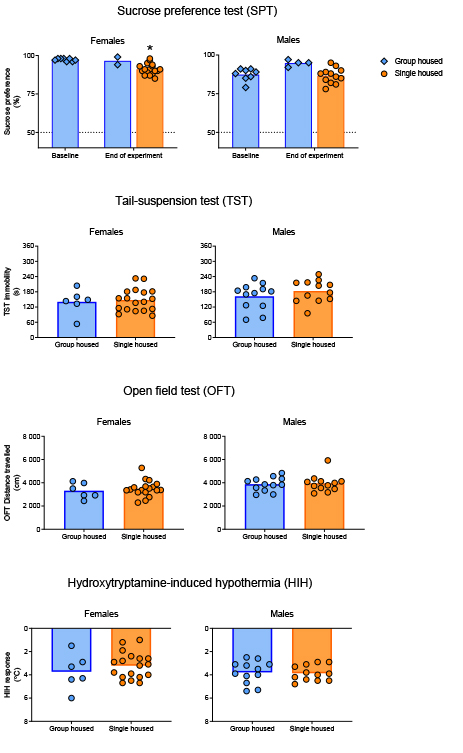
Following three weeks of single housing (on Day 21), neither female nor male mice differed in body weight (Figure 2) from their group housed counterparts (females: t22 = -0.57, p = 0.57; males: t22 = 0.71, p = 0.49). An ostensibly attenuated sucrose preference after three weeks’ single housing (Figure 3) was found for female but not male mice (females: t21.3 = 6.84, p < 0.01; males: t17.5 = 0.42, p = 0.68). No difference could be found in immobility time in the TST between single housed and group housed mice of either sex (females: t22 = -0.33, p = 0.74; males: t22 = -1.07, p = 0.30). Utilizing distance travelled in the OFT as an explanatory co-variate when comparing TST immobility time between groups did not reveal any differences masked by differing activity levels (females: F2,21 = 0.13, p = 0.73; males: F2,21 = 1.29, p = 0.27). The hypothermic response to a challenge with 8-OH-DPAT did not differ following differential housing for three weeks for either sex (females: t22 = 0.91, p = 0.46; males: t22 = -0.22, p = 0.83).
|
|
Figure 3. Results from a battery of tests
carried out to assess depressive states in single housed mice.
Figures listed in order from top to bottom: Sucrose preference
in percent of total intake; Time spent immobile in the
tail-suspension test (TST); Distance travelled in the open field
test (OFT); Hydroxytryptamine-induced hypothermia (HIH)
expressed as the drop in core body temperature from baseline.
All of the data are shown as subject-level measurements with
group means, with the exception of the sucrose preference where
the measurements are displayed on cage-level (measurements
collecting multiple individuals are shown as diamonds). The
asterisk denotes a significant difference at a level of p <
0.05 from baseline values. Click image to enlarge |
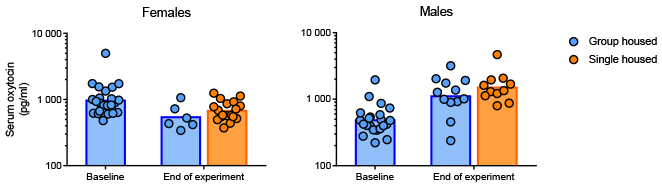
No differences were found between single housed and group housed mice for either sex (over time) with respect to serum oxytocin levels (females: F1,22 = 0.11, p = 0.74; males: F1,19 = 0.11, p = 0.74). Differences were however found between baseline levels and the samples obtained on Day 23 (Figure 4), with female mice exhibiting lower levels of oxytocin at the end of the study (housing conditions combined, paired data: t23 = 3.29, p < 0.01) and males demonstrating an inverse trend with higher levels toward the end of the study (housing conditions combined, paired data: t20 = -6.63, p < 0.001). Three serum samples (two baseline, one end of experiment) obtained from males were too small for analysis and were thus excluded (data considered missing at random).
|
|
Figure 4. Serum oxytocin levels measured
before (Day 0) and after (Day 23) differential housing. Data are
displayed as individual replicates with geometric means for the
groups on a logarithmic axis. Both for female and male mice, the
oxytocin levels at the end of the experiment were found to be
significantly altered from the baseline levels; but whereas the
females had reduced their serum oxytocin for the second
sampling, the males demonstrated an opposite trend. Click image to enlarge |
Post hoc analysis
The reduced sucrose preference for single housed female mice in the
SPT was considered questionable as there was no way of recording
spillage from the bottles. Utilizing an empty cage to estimate how
much fluid is lost to dripping bottles has been suggested (Eagle et
al., 2015), but we considered this unreliable as it does not account
for animal activity within the cage (differing with group size). With
a very high affinity for the 8 % sucrose solution, much of the tap
water lost was potentially due to spillage. For the group housed
animals any droplet lost would be shared between three animals,
affecting the test less, whereas routine operations in the animal room
rustling the racks and cages causing the water bottles to drip could
potentially make it seem as if the single housed mice drank more tap
water. As little as 1.5 ml lost, per 24 hours, due to dripping water
bottles, we found employing some simplistic calculations (Figure 5),
could produce the found significant difference. In a representative
setup, a droplet was estimated at 54 µl (10 droplets – average: 536
µl; SD: 76 µl) suggesting a loss of about a droplet an hour (1.17 h-1)
amounts to 3 ml over 48 hours. This is not an unrealistic loss given
that just opening a cage lid was found to spill at least 4-5 droplets.
Thus, to test whether the single housed female mice could truly be
considered anhedonic, we chose to test the absolute amount of sucrose
solution consumed, expressed per gram of mouse in the cage; after all,
anhedonia is defined as a lowered affinity for sucrose, not as an
increased interest in tap water.
|
|
Figure 5. Sensitivity analysis (left) and
total amount of sucrose solution consumed (per gram of animal)
for the female mice (right). The p values were estimated by
applying the Mann-Whitney U test (by ranks) in comparing
baseline sucrose preference to the single housed end of
experiment values. In increments of 1 ml (the measured
accuracy), liquid was subtracted equally from each bottle. The
seemingly low p value exceeds the critical level of 0.05 (dashed
line) already after a loss of 3 ml (i.e. 1.5 ml per 24 h). When
comparing the absolute intake of sucrose solution it becomes,
furthermore, clear that the single housed animals did not
consume less liquid than during baseline conditions. Click image to enlarge |
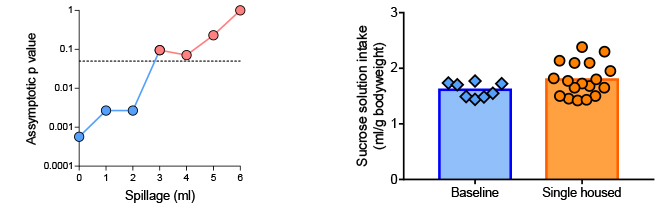
Sucrose intake was not normally distributed when expressed per gram bodyweight, consequently rank testing was used. When expressed in absolute amounts, no reduction in sucrose intake was found for the female mice following single housing (Mann-Whitney, U = 47, p = 0.17, r = 0.27). It has, therefore, to be concluded that the female mice did not become anhedonic when housed alone, but rather that the difference is better explained as tap water lost due to dripping bottles.
Discussion
In the present study, we were unable to replicate our previous findings showing an exacerbated 8-OH-DPAT-inducible hypothermic response in single housed male C57BL/6 mice over their group housed counterparts (Kalliokoski et al. 2014). When combining the HIH challenge with sucrose preference testing, blood samples, tail-suspensions and time spent in open field arenas, the effect previously found for a number of substrains of C57BL/6 was wholly missing. Recently, focus has been brought to the fickle nature of the p-value as the deciding factor in hypothesis testing. Even in the face of highly significant statistics and miniscule p-values the chance of a non-significant finding in an identical replication study is close to the chances of a coin toss coming up heads (Halsey et al. 2015). Although we cannot fully rule it out, the outcome of the HIH challenge in the present study seems to be more than just the case of chance deviation from a true difference. The data show not even the slightest trend toward a greater hypothermia in the single housed group. Whereas these data hardly refute our previous conclusions – the study collected data from 231 subjects across two experimental designs, after all – they do put them in a larger context. In another previous study (Kalliokoski et al. 2013), investigating the stressful nature of metabolism cage housing, we found the HIH challenge to produce erratic results when carried out shortly after a stressful behavioral test (the forced swimming test). In the present study, we suspect, similarly, that the stress-response in relation to being suspended from one’s tail, forced into an inescapable open arena, and blood samplings may have served to alter the hypothermic response to 8-OH-DPAT. The key follow-up question is whether the stressful nature of the battery of depression tests only confounds the HIH challenge, or whether it effectively destroys the purported depressive phenotype.
A reduced preference for a sweetened sucrose solution is in the SPT
paradigm interpreted as an expression of anhedonia. With depressions
comes a blunted feeling of joy, with previously enjoyable experiences
losing their appeal. A depressed mouse presented with the SPT setup
becomes less particular in choosing the sweetened solution over tap
water when drinking. Single housing has previously been suggested to
induce anhedonia in mice, demonstrable through the SPT (D’Andrea
et al. 2010). Nevertheless, within the framework of the present study,
we could not find any reliable evidence of anhedonia.
Similarly, our TST results did not differ between groups. Although the
TST has been used in comparable contexts, sometimes to seemingly good
effect (Martin and Brown 2010), the test has been suggested to be
principally appropriate for screening pharmacological candidates for
antidepressant potential, rather than for assessing
depression/depressive states (Nestler and Hyman 2010). Findings such
as the present ones, underscore the questionable appropriateness of
utilizing the TST for evaluating naturally occurring depressive
states. Not only is it unclear whether these are associated with the
poorly defined concept of emotional despair, but the stressful nature
of the test can potentially confound other tests and interfere with
depressive phenotypes. Alternative behavioral tests, affecting the
subjects’ emotional state less, are under similar circumstances
probably preferable. We combined the TST with an OFT, as it is
considered best practice to combine the TST with a test of general
activity. Without combining the tests, compounds such as caffeine and
amphetamines appear to have an antidepressant effect in the TST as
they decrease immobility (Steru et al. 1987). The OFT can however be
used to demonstrate that these compounds simply induce hyperactivity
(Marriott 1968). In the case of evaluating emotional states, removed
from the context of testing drug candidates, the distance travelled in
the OFT is hard to interpret. Should more active mice be considered
more or less likely to be depressed? Is this even a relevant factor?
Luckily, we can refrain from excessive speculation, as all of our mice
performed similarly across both the TST and OFT. Neither the TST nor
the TST in combination with the OFT was able to tell us anything
intelligible about the emotional state of our animals.
Oxytocin has a modulating effect in stress and anxiety. Studies in
prairie voles (Grippo et al. 2007a; Grippo et al. 2007b) have
demonstrated that circulating oxytocin levels change in response to
social isolation in concert with the onset of anhedonia (measured
using the SPT). We speculated that the negative outcome we previously
had noticed from single housing might thus be accompanied by
concomitant lowered levels of oxytocin. Our results, although not
supportive of our initial hypothesis, do suggest that measuring
circulating levels of oxytocin in laboratory mice may be of interest.
The consequences of oxytocin supplementation has been studied at great
lengths across a number of species (Smith et al. 2017), including mice
(Teng et al. 2013; Harrison et al. 2016). However, data on endogenous
circulating levels are all but completely missing. The fact that we
find oxytocin to be a highly dynamic marker is interesting, even
though we currently cannot interpret our results. There is cross-talk
at the level of the hypothalamus between the HPA axis and oxytocin
release (Neumann and Landgraf 2012). Elevated levels of oxytocin could
thus have been caused by a stress response in relation to the blood
samplings. With oxytocin levels having been shown to increase within
five minutes from an acute stress response (Gibbs 1984), this is not
unlikely. It may also be that collecting the blood samples immediately
following the SPT may have influenced our results. Oxytocin modulates
the feeling of satiation (Olszewski et al. 2010) and is thus likely to
change in relation to ad libitum feeding of a sucrose solution (Song
et al. 2014) with approximately the same caloric density as popular
soft drinks. More data needs to be collected on the endogenous
oxytocin levels in mice before we can explain our results in full;
however, differential housing appeared to have nothing to do with it.
With no results suggestive of depressive states, we allow ourselves to
speculate that it is most likely that the testing battery reversed the
previously found phenotype, or prevented it from being induced
altogether. Whereas the failure to reproduce previous findings could
be construed as evidence that the previous findings were erroneous or
a fluke (indications that we need to be watchful of, forging ahead),
the size of the present study is not sufficient to refute previous
evidence nor are the conditions of the experiments identical. Instead,
we will suggest that changes in testing protocol are a more likely
explanation to the difference in results. Whereas chronic prolonged
stress is a well-recognized model of depression (Willner 1997)
resembling human “burnout” syndrome (Wurm et al. 2016), it
is not unlikely that stress induced by e.g. behavioral testing may
counteract or over-shadow a social-isolation-induced depressive state.
Although stressful interventions interfering with inducible phenotypes
is certainly not a novel issue, it does present the question of how to
approach studying models such as this. Utilizing fewer tests per
subject reduces the amount of information we can gather from an
animal, which is in poor agreement with the reduction ideal of the
3Rs, as this increases rather than reduces the number of animals used
in a study. Perhaps it is time to update the tests we employ in
studying depressive states in laboratory animals. Behavioral tests
such as the TST, highly stressful tests likely to influence the
subjects greatly, and with unclear underlying rationales (what even is
“behavioral despair” in relation to human subjects?) to
boot, should probably be replaced by less invasive tests with clearer
frames of interpretation, e.g. judgement bias testing (Hoffman 2016;
Boleij et al. 2012). The information we collect will never be more
accurate than the means by which it is obtained.
Supplemental data
Complete raw data have been made freely available online for data synthesis, scrutiny, and reanalysis through the following link: https://figshare.com/s/d9ff904e5b039ded9197
References
- Arndt, S.S., Laarakker, M.C., van Lith, H.A., van der Staay, F.J., Gieling, E., Salomons, A.R., van 't Klooster, J., Ohl, F., (2009). Individual housing of mice—impact on behaviour and stress responses. Physiology & Behavior. 97, 385-393.
- Avey, M.T., Fenwick, N., Griffin, G., (2015). The use of systematic reviews and reporting guidelines to advance the implementation of the 3Rs. Journal of the American Association for Laboratory Animal Science. 54, 153-162.
- Bartolomucci, A., Parmigiani, S., Gioiosa, L., Ceresini, G., Palanza, P., (2009). Effects of housing social context on emotional behaviour and physiological responses in female mice. Scandinavian Journal of Laboratory Animal Science, 36, 87-95.
- Bert, B., Fink, H., Hörtnagl, H., Veh, R.W., Davies, B., Theuring, F., Kusserow, H., (2006). Mice over-expressing the 5-HT1A receptor in cortex and dentate gyrus display exaggerated locomotor and hypothermic response to 8-OH-DPAT. Behavioural Brain Research. 167, 328-341.
- Boleij, H., van 't Klooster, J., Lavrijsen, M., Kirchhoff, S., Arndt, S.S., Ohl, F., (2012). A test to identify judgement bias in mice. Behavioural Brain Research, 233, 45-54.
- Can, A., Dao, D.T., Terrillion, C.E., Piantadosi, S.C., Bhat, S., Gould, T.D., (2012). The tail suspension test. Journal of Visualized Experiments.59, e3769. doi: 10.3791/3769.
-
Cohen, J., (1988). Statistical power analysis for the behavioral
sciences. 2nd. Hillsdale, NJ: erlbaum.
D’Andrea, I., Gracci, F., alleva, E., Branchi, I., (2010). Early social enrichment provided by communal nest increases resilience to depression-like behavior more in female than in male mice. Behavioural Brain Research. 215, 71-76. - Directive 2010/63/EU of the European Parliament and of the Council on the protection of animals used for scientific purposes, (2010). Official Journal of the European Union.
-
Eagle, A.L., Mazei-Robison, M., Robison, A.J., (2015). Sucrose
preference test to measure stress-induced anhedonia.
The Journal of Neuroscience. 16, e1822.
doi: 10.21769/BioProtoc.1822.
Ferrari, P., Palanza, P., Parmigiani, S., Rodgers, R., (1998). Interindividual variability in Swiss male mice: relationship between social factors, aggression, and anxiety. Physiology & Behavior. 63, 821-827. - Gibbs, D.M., (1984). Dissociation of oxytocin, vasopressin and corticotropin secretion during different types of stress. Life Sciences. 35, 487-491.
- Grippo, A.J., Cushing, B.S., Carter, C.S., (2007a). Depression-like behavior and stressor-induced neuroendocrine activation in female prairie voles exposed to chronic social isolation. Psychosomatic Medicine. 69, 149.
-
Grippo, A.J., Gerena, D., Huang, J., Kumar, N., Shah, M., Ughreja,
R., Carter, C.S., (2007b). Social isolation induces behavioral and
neuroendocrine disturbances relevant to depression in female and
male prairie voles. Psychoneuroendocrinology.
32, 966-980.
Halsey, L.G., Curran-Everett, D., Vowler, S.L., Drummond, G.B., (2015). The fickle P value generates irreproducible results. Nature Methods. 12, 179. - Harrison, N., Lopes, P.C., König, B., (2016). Oxytocin and social preference in female house mice (Mus musculus domesticus). Ethology. 122, 571-581.
- Heredia, L., Torrente, M., Domingo, J.L., Colomina, M.T., (2012). Individual housing and handling procedures modify anxiety levels of Tg2576 mice assessed in the zero maze test. Physiology & Behavior. 107, 187-191.
- Hoffman, K.L., (2016). New dimensions in the use of rodent behavioral tests for novel drug discovery and development. Expert Opinion on Drug Discovery. 11, 343-353.
- Hooijmans, C., Ritskes-Hoitinga, M., (2013). Progress in using systematic reviews of animal studies to improve translational research. PLoS medicine. 10, e1001482.
- Huang, H.J., Liang, K.C., Ke, H.C., Chang, Y.Y., Hsieh-Li, H.M., (2011). Long-term social isolation exacerbates the impairment of spatial working memory in APP/PS1 transgenic mice. Brain Research. 1371, 150-160.
- Hunt, C., Hambly, C., (2006). Faecal corticosterone concentrations indicate that separately housed male mice are not more stressed than group housed males. Physiology & Behavior. 87, 519-526.
- Kalliokoski, O., Jacobsen, K.R., Darusman, H.S., Henriksen, T., Weimann, A., Poulsen, H E., Hau, J., Abelson, K.S., (2013). Mice do not habituate to metabolism cage housing--a three week study of male BALB/c mice. PLoS One. 8, e58460.
- Kalliokoski, O., Teilmann, A.C., Jacobsen, K.R., Abelson, K.S., Hau, J., (2014). The lonely mouse – Single housing affects serotonergic signaling integrity measured by 8-OH-DPAT-induced hypothermia in male mice. PLos One. 9, e111065.
- Marriott, A., (1968). The effects of amphetamine, caffeine and methylphenidate on the locomotor activity of rats in an unfamiliar environment. International Journal of Neuropharmacology. 7, 487-491.
- Martin, A.L., Brown, R.E., (2010). The lonely mouse: verification of a separation-induced model of depression in female mice. Behavioural Brain Research. 207, 196-207.
- Mayorga, A.J., Lucki, I., (2001). Limitations on the use of the C57BL/6 mouse in the tail suspension test. Psychopharmacology. 155, 110-112.
- Monleon, S., Parra, A., Simon, V., Brain, P., D'Aquila, P., Willner, P., (1995). Attenuation of sucrose consumption in mice by chronic mild stress and its restoration by imipramine. Psychopharmacology. 117, 453-457.
- Nestler, E.J., Hyman, S.E., (2010). Animal models of neuropsychiatric disorders. Nature Neuroscience. 13, 1161.
-
Neumann, I.D., Landgraf, R., (2012). Balance of brain oxytocin and
vasopressin: implications for anxiety, depression, and social
behaviors. Trends in Neurosciences. 35,
649-659.
Olszewski, P.K., Klockars, A., Schiöth, H.B., Levine, A.S., (2010). Oxytocin as feeding inhibitor: maintaining homeostasis in consummatory behavior. Pharmacology Biochemistry and Behavior. 97, 47-54. - Parsey, R.V., Oquendo, M.A., Ogden, R.T., Olvet, D.M., Simpson, N., Huang, Y.Y., van Heertum, R.L., Arango, V., Mann, J.J., (2006). Altered serotonin 1A binding in major depression: a [carbonyl-C-11] WAY100635 positron emission tomography study. Biological Psychiatry. 59, 106-113.
- Peng, W.H., Lo, K.L., Lee, Y.H., Hung, T.H., Lin, Y.C., (2007). Berberine produces antidepressant-like effects in the forced swim test and in the tail suspension test in mice. Life Sciences. 81, 933-938.
- Pothion, S., Bizot, J.C., Trovero, F., Belzung, C., (2004). Strain differences in sucrose preference and in the consequences of unpredictable chronic mild stress. Behavioural Brain Research. 155, 135-146.
- Richter, S.H., Garner, J.P., Würbel, H., (2009). Environmental standardization: cure or cause of poor reproducibility in animal experiments? Nature Methods. 6, 257.
- Rosenthal, R., (1979). The file drawer problem and tolerance for null results. Psychological Bulletin, 86, 638.
- Sáenz, J.C.B., Villagra, O.R., Trías, J.F., (2006). Factor analysis of forced swimming test, sucrose preference test and open field test on enriched, social and isolated reared rats. Behavioural Brain Research. 169, 57-65.
- Savitz, J., Lucki, I., Drevets, W.C., (2009). 5-HT(1A) receptor function in major depressive disorder. Progress.in Neurobiology. 88, 17-31.
-
Schipper, L., Harvey, L., Beek, E., Dijk, G., (2018). Home alone: a
systematic review and meta‐analysis on the effects of individual
housing on body weight, food intake and visceral fat mass in
rodents. Obesity Reviews. 19, 614-637.
doi: 10.1111/obr.12663.
Smith, J.E., Petelle, M.B., Jerome, E.L., Cristofari, H., Blumstein, D.T., (2017). Oxytocin experiments shed light on mechanisms shaping prosocial and antisocial behaviors in non-human mammals. Integrative and Comparative Biology. 57, 619-630. - Song, Z., Levin, B.E., Stevens, W., Sladek, C.D., (2014). Supraoptic oxytocin and vasopressin neurons function as glucose and metabolic sensors. American Journal of Physiology - Regulatory, Integrative and Comparative Physiology. 306, R447-R456.
- Späni, D., Arras, M., König, B., Rülicke, T., (2003). Higher heart rate of laboratory mice housed individually vs in pairs. Laboratory Animals. 37, 54-62.
- Steru, L., Chermat, R., Thierry, B., Mico, J.A., Lenegre, A., Steru, M., Simon, P., Porsolt, R.D., (1987). The automated tail suspension test: a computerized device which differentiates psychotropic drugs. Progress in Neuro-Psychopharmacology and Biological PsychiatryI. 11, IN1-671.
- Steru, L., Chermat, R., Thierry, B., Simon, P., (1985). The tail suspension test: a new method for screening antidepressants in mice. Psychopharmacology. 85, 367-370.
-
Teng, B.L., Nonneman, R.J., Agster, K.L., Nikolova, V.D., Davis,
T.T., Riddick, N.V., Baker, L.K., Pedersen, C.A., Jarstfer, M.B.,
Moy, S.S., (2013). Prosocial effects of oxytocin in two mouse models
of autism spectrum disorders. Neuropharmacology.
72, 187-196.
Thornton, A., Lee, P., (2000). Publication bias in meta-analysis: its causes and consequences. Journal of clinical epidemiology. 53, 207-216. - Valentinuzzi, V.S., Buxton, O.M., Chang, A.M., Scarbrough, K., Ferrari, E.A., Takahashi, J.S., Turek, F.W., (2000). Locomotor response to an open field during C57BL/6J active and inactive phases: differences dependent on conditions of illumination. Physiology & BehaviorI. 69, 269-275.
- van Loo, P.L., de Groot, A.C., van Zutphen, B.F., Baumans, V., (2001). Do male mice prefer or avoid each other's company? Influence of hierarchy, kinship, and familiarity. Journal of Applied Animal Welfare Science. 4, 91-103.
- van Loo, P.L., van de Weerd, H.A., van Zutphen, L.F., Baumans, V., (2004). Preference for social contact versus environmental enrichment in male laboratory mice. Laboratory Animals. 38, 178-188.
- Voikar, V., Polus, A., Vasar, E., Rauvala, H., (2005). Long‐term individual housing in C57BL/6J and DBA/2 mice: assessment of behavioral consequences. Genes, Brain and Behavior. 4, 240-252.
- Willner, P., (1997). Validity, reliability and utility of the chronic mild stress model of depression: a 10-year review and evaluation. Psychopharmacology. 134, 319-329.
- Würbel, H., (2000). Behaviour and the standardization fallacy. Nature Genetics. 26, 263.
- Wurm, W., Vogel, K., Holl, A., Ebner, C., Bayer, D., Mörkl, S., Szilagyi, I.S., Hotter, E., Kapfhammer, H.P., Hofmann, P., (2016). Depression-burnout overlap in physicians. PLoS One. 11, e0149913.
- Yoon, S.H., Kim, B.H., Ye, S.K., Kim, M.H., (2014). Chronic non-social stress affects depressive behaviors but not anxiety in mice. The Korean Journal of Physiology & Pharmacology. 18, 263-268.