
Original scientific article
Humane endpoints in severe irradiation experiments using non-human
primates: a retrospective analysis
by Jean-Marc Bertho1*, Sophie Ancelet1, Delphine Denais-Laliève1, Nicolas Dudoignon2
1Institut de Radioprotection et de Sûreté Nucléaire (IRSN),
PSE-SANTE/SESANE, Laboratoire de radiotoxicologie et radiobiologie
expérimentale (LRTOX)
2Present address : Sanofi R&D, Translational In vivo Models, 1
Avenue Pierre Brossolette, 91385 Chilly-Mazarin cedex, France.
 Correspondence: OJean-Marc Bertho
Institut de Radioprotection et de Sûreté Nucléaire (IRSN),
PSE-SANTE/SESANE,
Laboratoire de radiotoxicologie et radiobiologie expérimentale
(LRTOX),
BP 17, 92262 Fontenay-aux-Roses cedex, France.
E-mail address: jean-marc.bertho@asn.fr
Summary
A retrospective statistical study has been performed in order to
identify the biological, clinical and behavioural variables that could
potentially predict the survival status of irradiated non-human
primates (NHP) and to refine the future use of humane endpoints (HEP).
The available data come from experiments that were initially designed
and implemented to evaluate the efficacy of various treatments of the
radiation-induced haematopoietic syndrome. A group of 15 NHPs was
selected on the basis of similar irradiation and treatment protocols.
Among those 15 NHPs, 3 animals died during the study despite efforts
developed to prevent intense suffering and death. Among individual
variables collected during the study, the ones retained for the
present analysis were Flt3-ligand concentration in plasma, body
temperature, alimentary behaviour and general behaviour score. A
Bayesian predictive analysis showed that, although some of these
variables were of potential interest, none of them alone proved
valuable in predicting the death of the three animals. A refined
analysis showed that a rapid decrease in body temperature during 3
consecutive days of more than 2.5°C was predictive of the death of two
out of three animals. Moreover, a combination of several variables
including decrease in body temperature and general behaviour score,
improved the prediction of death. These results confirm that a HEP
cannot only rely on the use of a single variable, suggesting using a
combination of variables, including behaviour, as a composite HEP in
NHP experiments using high doses of irradiation.
Introduction
The study of past accidents has shown that human victims of accidental irradiation develop an acute radiation syndrome (ARS). As a part of this ARS, the haematopoietic syndrome appears as a consequence of radiation doses as low as 0.5 Gy and is lethal in humans with whole body radiation doses higher than 4-5 Gy. Manifestations of this haematopoietic syndrome are pancytopenia, thrombocytopenia and anaemia with haemorrhages and opportunistic infections of graded severity depending on the radiation dose (Goans and Waselenko 2005). The haematopoietic syndrome remains difficult to treat and is the first cause of victim death following accidental irradiation (Densow et al. 1997; Coeytaux et al. 2015). Thus, alternative therapeutic strategies have to be developed and tested, such as the ex vivo expansion of bone marrow cells (Herodin and Drouet 2002; Thierry et al. 2005) or cytokine injection (Herodin et al. 2007).
These alternative therapeutic strategies could not be tested directly
on humans for obvious ethical reasons. Furthermore, in silico and in
vitro methods were not relevant to address such complex questions.
Although rodents were also used to address preliminary questions on
irradiation-induced conditions (Prat et al. 2005; Prat et al. 2006),
it should be noted that the physiology of these rodent models is not
relevant enough for human physiology. Therefore, we developed a
non-human primate (NHP) model (M. fascicularis) of bone marrow aplasia
after irradiation in a heterogeneous, high dose field of gamma rays
(Bertho et al. 2002). This model proved to be the most relevant and
reproducible among other species to mimic the complexity of human
accidental irradiation (Cui et al. 2016; Williams et al. 2010; Farese
et al. 2012).
Various experimental therapeutic strategies were applied to NHPs
immediately after irradiation, including autologous bone marrow
transplantation, ex vivo expanded autologous haematopoietic cells
and/or cytokine injections. These experimental therapeutic strategies
have been extensively described and studied previously (Bertho et al.
2002; Bertho et al. 2005a; Bertho et al. 2005b). The clear-cut
objective was to define the best possible treatment to apply in
relation to the kinetic and severity of the bone marrow aplasia in
order to foster the haematopoietic recovery. During the course of the
performed experiments, the survival of animals was the main objective,
through the use of experimental treatments, nursing and supportive
care. Survival was defined as animals remaining alive for at least 60
days after irradiation with a full recovery of haematopoietic
parameters. Expectedly, such protocols required intensive clinical
support (antibiotics, fluid perfusion, platelet and red blood cell
transfusion) along with a detailed monitoring of numerous parameters
and the evaluation of the severity of the condition induced by
high-dose irradiation. The definition of humane endpoints (HEP) for
these experiments was an absolute requirement that was discussed with
the animal care and use committee during the prospective ethical
evaluation.
Although at the time of these experiments the definition of HEP was
not a legal requirement, provisional HEPs were set based on
biological, clinical and behavioural parameters that could be
collected easily on a daily basis for each animal during
experimentation. These parameters are the number of white blood cells
(WBC), number of platelets (plt), number of red blood cells (RBC),
Flt3-ligand (FL) concentration in plasma (a cytokine used as a
biological indicator of bone marrow aplasia) (Bertho et al. 2001;
Huchet et al. 2003; Prat et al. 2006), body temperature (BT), and a
few alimentary and general behavioural features. These various
parameters are thereafter referred to as “variables” or “covariates”.
For BT and behaviour, some provisional scores and thresholds were
empirically defined as provisional HEP. Some of these have been
already used by other groups in various experimental settings either
with rodents (Olfert and Godson 2000) or with NHPs (Fante et al. 2007;
Menon et al. 2016) and have shown to warrant some interest. All
possible actions were taken to keep the NHPs alive in order to attain
the experimental endpoint with all possible constraints to animal
suffering thereby safeguarding as well as possible animal well-being
and welfare. A few animals died suddenly at various points in time,
despite the attempts to maintain their clinical status. Anticipated
euthanasia could not be done because of the very rapid deterioration
in the health of the animal. This demonstrated that the provisionally
defined HEPs were not adequately predictive.
The aim of the present analysis was to perform a retrospective
statistical assessment of these experimental data to identify
biological, clinical and behavioural covariates that could potentially
better predict the survival status of irradiated NHPs and to refine
the definition of HEPs in similar experiments using NHPs. This study
should be relevant in the context of the new French regulation
(Ministry of agriculture Act No 2013-118, 2013) according to the
European directive 2010/63 (2010) in which the retrospective
assessment of the actual procedural severity is mandatory for all
severe projects and for all projects using NHPs regardless of
severity, with the objective of refining future animal use.
Identification of the most predictive factors of NHP survival, an
observed variable that is uncertain by nature in such experimental
conditions, can be easily formalized as a problem of statistical
prediction. The aim was then to compare the ability of several
probability models, including one or more potentially predictive
covariates, to reproduce plausible survival status. This approach was
performed under the Bayesian statistical framework whose main
advantage, in a predictive context, is to account for the uncertainty
associated with unknown variables encountered in the prediction
process, especially when the sample size is reduced.
Materials & Methods
Animals and housing conditions
Fifteen male crab-eating macaques (Macaca fascicularis, n=15),
originating from a breeding colony (former Centre de recherches en
primatologie Ltd, Le Ferney, Mauritius) were used in this study. On
arrival, they were quarantined for 8 weeks during which clinical and
blood analysis were conducted. Animals were all tested negative for
common pathogenic and interfering viruses such as Herpes B virus,
Filovirus, STLV-1, SIV, EBV, CMV and Hepatitis B virus and were in
good health.
The macaques were housed in a specific animal facility with temperature control (22°C ± 1°C) and a day/night light cycle of 12 hrs. They received controlled quantities of sterilised primate chow (Safe, France) and fresh fruits and/or vegetables every day, and free access to water. Immediately after arrival in the animal care facility, the animals were housed in pairs using two connected cages. During experimental procedures, cages were placed in a laminar air flow to protect animals from opportunistic infections. In this manner, they were housed individually, but maintaining visual, auditory and olfactory contact between pairs. All animals were trained for restrain and manipulation (Including BT measurement at the armpit and blood sampling at the arm) before the experimental procedure was applied. Mean age and body mass at the start of the experiment were 40 ± 4.5 months (range 32.6-47.7) and 3.54 ± 0.58 kg (range 2.75-4.70 kg), respectively (Table 1).
For the purpose of platelet or red blood cells transfusion of
irradiated animals and after approval of the animal care committee, a
colony of healthy NHP housed in the same facility was used as blood
donors. In order to prevent risks of anaemia of the donor animals, the
volume of blood drawn was limited to 0.5% of the body mass per month.
This represents approximately 50 ml of blood for a 10 kg donor animal.
All experimental procedures and all use of animal were subjected to
and approved by the animal care and use committee of IRSN (protocols #
CE-03-20 and CE-01-05) and in compliance with French regulations in
application at the time of these experiments (Ministry of agriculture
Acts No. 87-848, 1987 and No. 2001-464, 2001).
Table 1. Summary of animal age and body mass at the time of irradiation, irradiation procedure and following treatments of the haematopoietic syndrome.
|
Animal id. |
Age, months |
Body mass, kg |
Radiation dose, Gya |
Treatmentb |
Survivalc |
Reference |
AB470 |
44.3 |
4.70 |
8/3.4 |
Untreated |
Yes |
Bertho et al 2005a |
AA870 |
35.7 |
3.45 |
10/4.4 |
EHC |
No (31)d |
|
AA809 |
32.6 |
4.05 |
8/3.4 |
EHC |
Yes |
|
AB413 |
44.7 |
3.25 |
8/3.4 |
EHC |
Yes |
|
AA208 |
38.2 |
3.80 |
10/4.4 |
I-EHC |
Yes |
|
AA592 |
36.6 |
3.15 |
10/4.4 |
I-EHC |
No (24) |
|
AA295 |
46.5 |
4.15 |
8/3.4 |
I-EHC |
Yes |
|
AA900 |
44.3 |
4.40 |
8/3.4 |
I-EHC |
Yes |
|
AA864 |
47.7 |
3.60 |
8/3.4 |
I-EHC |
Yes |
|
AF382 |
37.4 |
2.85 |
8.5/4.5 |
G-CSF |
Yes |
Bertho et al 2005b |
AF373 |
39.9 |
2.75 |
8.5/4.5 |
G-CSF |
No (20) |
|
AF569 |
39.6 |
3.30 |
8.5/4.5 |
G-CSF |
Yes |
|
AF270 |
36.7 |
3.05 |
8.5/4.5 |
I-EHC + G-CSF |
Yes |
|
AF384 |
36.5 |
3.00 |
8.5/4.5 |
I-EHC + G-CSF |
Yes |
|
AF477 |
39.3 |
3.60 |
8.5/4.5 |
I-EHC + G-CSF |
Yes |
a A heterogeneous irradiation configuration was used by
shielding the right arm during a part of irradiation. Values indicate
the dose to the whole body/the dose to the shielded arm. Please see
details in (Bertho et al, 2005a).
b Haematopoietic treatments were detailed in (Bertho et al,
2005a, Bertho, et al, 2005b, Bertho et al, 2002). EHC: Expanded
haematopoietic cells; I-EHC: irradiated then expanded haematopoietic
cells. G-CSF: Granulocyte-colony stimulating factor daily s.c.
injection at 5 µg/kg.
c Survival was defined as animal still alive 60 days after
irradiation with a full recovery of haematopoietic parameters.
d Time of death after irradiation is indicated in brackets
(days).
Experimental procedures
Experimental procedures have been described previously in detail
(Bertho et al. 2005a; Bertho et al. 2005b). Here follows a concise
overview. Animals were irradiated under general anaesthesia using a
mixture of ketamine (Imalgene, 100mg/kg, Merial, Lyon, France) and
Xylazine (Rompun, 2 mg/kg, Bayer Healthcare, Puteaux, France) in a
homogeneous high-dose gamma ray field using 60Co sources. The mean
dose rate along these experiments was 0.181 ± 0.018 Gy/min.
Heterogeneity of irradiation, which was used to reproduce accidental
irradiation patterns in humans, was obtained by protecting the right
arm with a lead shield during a part of the irradiation procedure.
According to the experimental design, animals received one out of five
different treatment protocols: ex vivo expanded autologous
haematopoietic stem cells collected either before or after irradiation
(Bertho et al. 2002; Bertho et al. 2005a; Bertho et al. 2005b),
granulocyte-colony stimulating factor injection (G-CSF, Lenograstim,
kindly provided by Chugai Pharma, France), or a combination of G-CSF
treatment and irradiated expanded autologous haematopoietic cells
(Bertho et al. 2005a). Five treatment groups were then constituted in
these studies: Untreated control, G-CSF treatment, irradiated or not
irradiated expanded haematopoietic cells (I-EHC and EHC), and a
combination of I-EHC and G-CSF. In the entirety of these experiments,
only one animal was irradiated but not treated, neither with cytokine
nor with haematopoietic cells to serve as a negative control. However
this animal received the same level of clinical care as the other
animals. All other experimental groups were composed of at least three
animals (Table 1). It should be noted that irradiation protocols may
vary within treatment groups. Such intra-group variability was
accounted for with relevant probabilistic models. In this manner all
available animals were included in the study in order to optimize the
statistical power of this study (see results section).
All animals received an intensive clinical support during the experiment with a single i.v. injection of Dexamethasone (5 µg/kg of body weight, Dexazone®, UVA, Ivry sur Seine, France) immediately after the end of irradiation to limit the initial acute inflammatory reaction. Animals also received antibiotic treatment starting two days after irradiation (oral administration of colistine 100 mg/kg/day (Acti-coli B®, Biové, Arques, France) and systemic treatment with gentamicin 40 mg/kg/day and ampicillin 160 mg/kg/day (Bi-genta®, Shering-Plough, Segré, France)), fluid perfusion, platelet and red blood cell transfusion as necessary (according to the following thresholds: Plt counts less than 20x109/L and RBC counts less than 3x10¹² RBC/L, respectively) and special nutriments to stimulate appetite (fruit juice, dry fruits, hyper-energetic food if required). This clinical support continued until the animals recovered normal blood variables and normal alimentary behaviour.
Follow-up of animals and scoring
Starting 10 days before irradiation and continuing until full
haematopoietic recovery, a daily (increased to several times a day
during critical periods) follow-up of animals was performed. Body
temperature at the armpit using a paediatric electronic thermometer
was recorded every morning. Daily clinical support (as described
above) was then carried out according to the blood variables analysis.
A blood sample (1 ml) was drawn into EDTA coated tubes (BD, le pont de
claix, France) daily in the morning and was used to monitor cell count
and formula, FL, and other biochemical variables. The amount of food,
water consumption, quantity and quality of faeces, appearance of
petechiae and small haemorrhages on the skin and general behaviour and
appearance status were recorded every morning as well. Each of these
five variables was graded on a scale of 1 to 5 or 6, 5 or 6 being the
worst, with possible graduation by step of 0.5 (Table 2). At each
observation time, the five scores were summed to obtain a general
score accounting for behaviour, haematological and digestive clinical
signs. This total score together with body temperature and plasma FL
concentration were used as HEP, with provisionally defined thresholds
for each of the parameters.
Table 2. Clinical/behavioural score. Score scale for the evaluation of clinical and behavioural status of animals during the course of experiment. This evaluation was made daily in the morning from 10 days prior irradiation until the end of experiment.
|
Category |
Description |
Score |
Food intakea |
Eat normally the food ration (2x/day: fruits and chow) |
1 |
|
Eat normally either fruits or chow, leave partly (<75%) the other |
2 |
|
Eat normally one of the two components |
3 |
|
|
Eat partially (<75%) one of the two components |
4 |
|
Eat very little (<25%) or do not eat |
5 |
|
Beverage intakeb |
Drink 100% (ad libitum) |
1 |
Drink 75-100% |
2 |
|
Drink 50-75% |
3 |
|
Drink 25-50% |
4 |
|
Drink 0-25% |
5 |
|
|
Faeces as compared to |
Normal in appearance, quantity similar |
1 |
Smooth formed faeces, quantity similar |
2 |
|
Unformed faeces, higher quantity |
3 |
|
Diarrhoea |
4 |
|
Highly liquid diarrhoea |
5 |
|
Haemorrhagic diarrhoea |
6 |
|
|
Cutaneous |
No skin haemorrhagic sign |
1 |
Few cutaneous petechiae |
2 |
|
Numerous cutaneous petechiae |
3 |
|
|
Small cutaneous haemorrhages |
4 |
|
|
Substantial cutaneous haemorrhages |
5 |
|
Behavioure |
Usual behaviour/interaction |
1 |
|
Normal behaviour/interaction but appears quiet |
2 |
|
|
Reacts to stimulation but tendency to prostration |
3 |
|
|
Sleepy animal, show prostration with slow reactions |
4 |
|
|
Complete prostration, no reaction to stimuli |
5 |
a The normal food ration consisted of two fruits and 500 g
of primate chow, distributed in two portions each day. The score was
based on an estimate of the eaten fraction of the daily ration.
b Drinking water was provided ad libitum. The individual
normal intake was evaluated during the 10-days control period before
irradiation and the score was then based on the estimated percent of
water intake as compared to the control period.
c Animals were followed for all variables (including
clinical, behavioural and blood variables) during a 10-days control
period before irradiation.
d Petechiae are defined as visible cutaneous haemorrhages
of less than 1 mm diameter and cutaneous haemorrhages are defined as
more than 1 mm diameter. “Few” refers to less than 10-20 petechiae
visible on the face and on parts of the body without fur. “Numerous”
refers to more than 20-50 visible petechiae. A suspicion of internal
haemorrhage is linked to clinical manifestations such as abnormal skin
swelling.
e The behaviour score is based on comparing the behaviour
during the experiment with behaviour before the experiment, i.e.
during normal housing.
Group comparison
In a preliminary statistical analysis, the data were split into two
groups, according to the survival status of animals (dead or alive).
These two groups were then compared using Student’s t tests. The level
of statistical significance was set as p<0.05.
Statistical prediction method
Standard logistic regressions were assumed to predict the binary
survival status of each primate i (i=1,…,15), defined as its survival
status (i.e., dead/alive) 60 days after irradiation, given one or
several potential predictive factors. Univariate regressions were
tested first. Then, specific bivariate and trivariate regressions were
considered depending on the results obtained with the univariate
models. All potential predictive factors were centred and standardized
to avoid numerical problems. Due to the small number of available
data, more complex models were not considered. Working under the
Bayesian paradigm, prior probability distributions were assigned to
all the unknown regression parameters to reflect the uncertainty of
these quantities. For all parameters, due to a lack of information,
centred normal priors with high variance 103 were assumed. All the
considered models are summarized in Table 3.
Bayesian model fitting was performed using the software OpenBUGS for Bayesian analysis of statistical models using Markov Chain Monte Carlo (MCMC) techniques (Gelman, 2013, Lunn, 2012). For each model, 2 Markov chains were run for 70,000 cycles with a burn-in period of 10,000 cycles. As a consequence, the posterior samples associated to each unknown parameter included 120,000 values. The convergence of MCMC algorithms was checked by visual inspection of the simulated Markov chains and by computing intra-chain autocorrelations and Gelman-Rubin Statistics thanks to the R package Coda.
A cross-validation method (Geisser and Eddy 1979; Bernardo 2008;
Gelman 2013) was implemented to gauge the predictive ability of each
considered logistic regression using a sample of 120,000 values
(directly derived under OpenBUGS) from the posterior predictive
distribution (PPD) of the survival status of each primate. Each PPDi
represented the uncertainty associated with the prediction of the
survival status of primate i (i=1, ..., 15) after fitting a given
logistic regression on the available dataset but excluding the
survival status of primate i (to avoid double use of the same data).
The observed survival status yi of primate i was compared with the
associated posterior predictive sample (PPS) using plots and numerical
scores. The aim was to identify the logistic regression(s) for which
the obtained PPS look the most plausible (i.e., both close to the
observed yi and precise), given the observed survival data.
Three PPS, averaged over 15 primates, were computed to evaluate the
predictive ability of each logistic regression: a) the average Brier
Score (BS) (Brier 1950): this score measures the mean squared
difference between the predicted probabilities of death and the
observed survival status; b) the average logarithmic score (LogS)
(Good 1952): this score is closely related to the value of the
posterior predictive probability assessed at the observed vital status
and which should be close to 1; and c) the average zero-one score
(01S): this score corresponds to the success rate in predicting the
primates’ survival status (Gneiting and Raftery 2007).
Table 3. Bayesian estimates (i.e., posterior median), 95% credible intervals (CI) of the regression coefficients, predictive abilities (summarized with the average predictive scores: BS, LogS and 01S) of the different logistic regressions and number of failed predictions relative to the 3 deceased animals. The Intercept model corresponds to the model without any covariate, the probability of death is assumed to be the same for all the primates. Bold numbers indicate the lowest value for LogS and BS, the highest value for 01S.
|
Model |
LogS |
BS |
01S |
Number of failed predictions |
Posterior median |
UNIVARIATE |
Intercept |
0.58 |
0.18 |
0.80 |
3/3 |
-1.47 [-3.02 ; -0.28] |
|
Treatment |
1.22 |
0.29 |
0.80 |
3/3 |
- 1.73 [-5.19; 0.37] (EHC) |
|
Age |
0.65 |
0.21 |
0.73 |
3/3 |
-1.38 [-3.88 ; 0.39] |
|
BT min_30 days1 |
0.63 |
0.21 |
0.67 |
3/3 |
-1.07 [-2.87 ; 0.35] |
|
FL max |
0.70 |
0.19 |
0.73 |
3/3 |
1.21 [-0.27 ; 3.21] |
|
Body mass |
0.61 |
0.19 |
0.73 |
3/3 |
-1.99 [-5.51 ; 0.01] |
|
MBS |
0.71 |
0.16 |
0.73 |
2/3 |
0.67 [0.12 ; 1.61] |
|
2days BT ↓ max |
0.68 |
0.16 |
0.80 |
2/3 |
2.65 [0.40 ; 6.02] |
|
Radiation dose |
0.66 |
0.17 |
0.80 |
2/3 |
1.83[0.31 ; 4.16] |
|
4days BT ↓ max |
0.66 |
0.12 |
0.87 |
1/3 |
2.36 [0.62 ; 5.48] |
|
5days BT ↓ max |
0.63 |
0.11 |
0.93 |
1/3 |
2.98 [0.79 ; 7.21] |
|
7days BT ↓ max |
0.62 |
0.09 |
0.93 |
1/3 |
2.53 [0.67 ; 6.49] |
|
6days BT ↓ max |
0.56 |
0.10 |
0.87 |
1/3 |
3.23 [0.88 ; 8.86] |
|
BT min NADIR |
0.65 |
0.13 |
0.87 |
1/3 |
-6.9 [-19.31 ; -1.64] |
|
3days BT ↓ max |
0.50 |
0.12 |
0.87 |
1/3 |
5.01 [1.45 ; 13.36] |
|
BIVARIATE |
3days BT ↓ max + radiation dose |
0.67 |
0.17 |
0.73 |
1/3 |
6.16 [1,29; 16,02] 1.57 [-1,98; 6,04] |
|
BT min NADIR + |
0.97 |
0.15 |
0.87 |
1/3 |
-12.02 |
|
|
BT min NADIR |
0.41 |
0.13 |
0.80 |
2/3 |
-34.93[-77.95 ; |
|
|
3days BT ↓max |
0.26 |
0.09 |
0.80 |
2/3 |
15.6 [4.60 ; 32.19] |
|
TRIVARIATE |
max 3days BT ↓ + MBS + radiation dose |
0.39 |
0.13 |
0.80 |
2/3 |
15.0 [2.63 ; 37.88] |
Abbreviations: BT min_30 days: Minimal body temperature over the 30-day period post-irradiation; FL max: Maximal FL concentration over the 30-day period post-irradiation; (x)days BT ↓ max: Maximal body temperature decrease during (x) consecutive days; BT min NADIR: Minimal body temperature before the NADIR; MBS: Maximal behavior score.
Results
Data description
The fifteen animals were chosen for this study based on very similar
irradiation protocols with the exception of three animals that
received a higher radiation dose: 10 Gy vs. 8 Gy heterogeneous
protocol, as previously described (Bertho et al. 2005a; Bertho et al.
2005b) (Table 1). Out of these fifteen animals, three (Animal Id:
AA870, AA592, AA373) died during the experiment, between day 20 and 31
post-irradiation (Table 1). Two of them received a 10 Gy irradiation
dose; the third one received an 8 Gy radiation dose. A detailed
analysis of findings at autopsy was given in (Bertho et al. 2005a;
Bertho et al. 2005b).
Figure 1 shows the post-irradiation temporal evolution of white blood
cell (WBC) numbers (Figure 1A) and Flt3-ligand concentration (Figure
1D) in the blood of the three deceased animals and in three animals
that survived after receiving similar irradiation and treatment
(Figures 1C and 1F). Both the decrease in WBC numbers and the increase
in FL concentration are characteristics of an acute haematopoietic
syndrome induced by high-dose irradiation, as can be encountered in
radiation accidents (Hirama et al. 2003; Bertho et al. 2008). The
NADIR (the time in days after irradiation at which the minimal value
for WBC numbers is reached) varied between day 15 and 20 and the
number of WBC at the NADIR varied between 0.04x10⁶ and 0.44x10⁶
WBC.L-1 (Figures 1A to 1C). Additionally, important variations are
observed in the FL concentration in plasma according to the time
post-irradiation (Figures 1D to 1F). This concentration is inversely
correlated to the severity of the haematopoietic syndrome, and a
decrease in FL concentration is a sign of recovery (Bertho et al.
2008). However, as can be seen from figure 1 D-F, the maximal value of
FL concentration varied between 2257 pg.mL-1 and 5495 pg.mL-1 and the
duration of the plateau phase was between 15 and 30 days. No
significant difference between surviving and dying animals were
observed according to the WBC NADIR (Figure 1B) or the maximal FL
concentration in the blood (Figure 1E) (Student’s t test).
|
|
Figure 1. Timeline of the different improvements introduced. Individual studies are listed in chronological order on the
left side of the arrow and improvements are listed on the right
side of the arrow. Click image to enlarge |
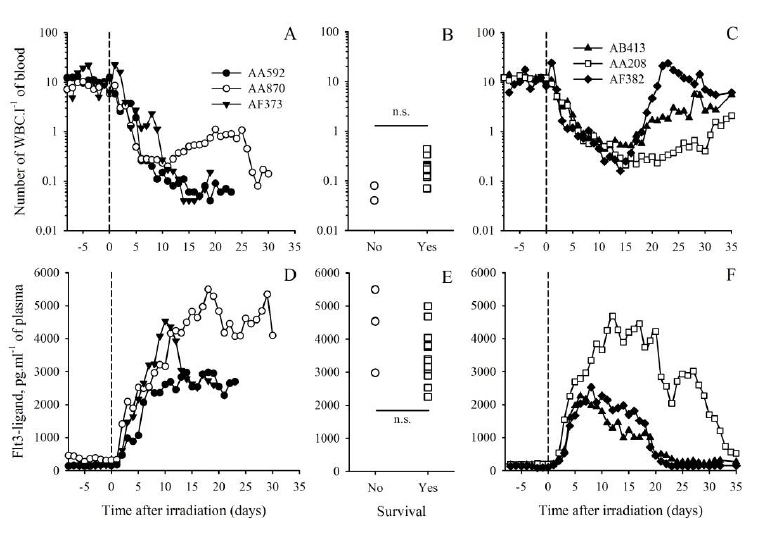
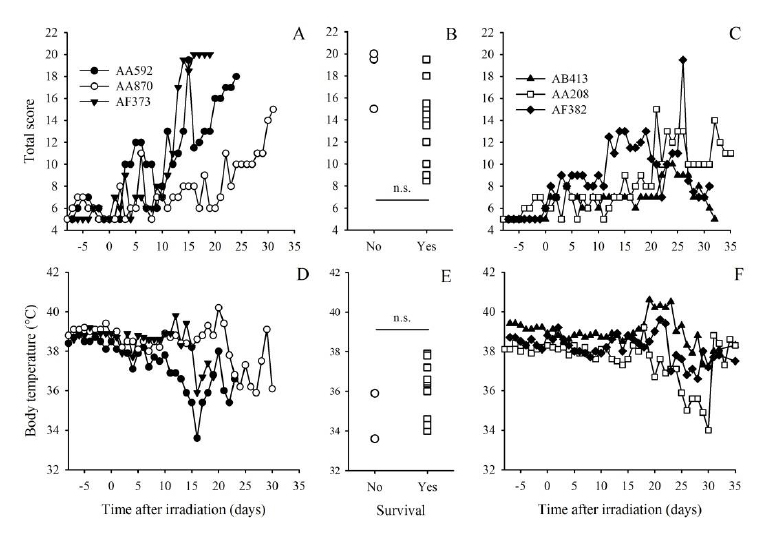
Figure 2 shows the development of the behaviour score, including feeding and drinking behaviour, clinical signs of haematological and digestive disease and general behaviour (Table 2), for the three deceased animals (Figure 2A) and for three animals receiving a similar treatment protocol out of the twelve that survived (Figure 2C). The general score showed day to day variations with the exception of animal AF373 that stayed for 4 days at a high value (20 as compared to 26 worst score) before dying. During this period this particular animal showed other signs of a possible recovery, as suggested by decreasing FL concentration (from 4535 pg.mL-1 on day 10 down to 2520 pg.mL-1 on day 16, see Fig 1D) and slight increase in body temperature (From 35.9 °C on day 16 up to 37.8 °C on day 18, see Figure 2D). The positive development of these two variables justified the continuation of the experiment. The comparison of the individual maximal behaviour scores (MBS) observed for each of the three deceased animals with the MBS observed for each of the twelve animals that survived (Figure 2B) showed no significant difference between the two groups (Student’s t test). Based on these results, the MBS value did not seem to be predictive of the death of animals.
The progression of body temperature (BT) values for the three deceased
animals is presented in Figure 2D and for three of the twelve animals
that survived in Figure 2F. BT exhibited day-to-day variations during
these experiments with a different pattern for each animal.
Hypothermia has been suggested as a possible HEP in rodents (Becker et
al. 1998; Olfert and Godson 2000), and in fact, hypothermia was
observed in the three deceased animals, close to 36°C for two animals
and down to 34°C for one animal (Figure 2D). When comparing these
three animals with the 12 animals that survived, other cases of
hypothermia were observed, in the range of 34-35°C (Figures 2E and F).
As expected, the comparison of minimal BT in the three deceased
animals with the 12 animals that survived did not allow for the
conclusion that the two groups of animals differ significantly
(Student’s t test, p>0.05). Hypothermia even down to 34 °C, and
although critically informative, appears not to be sufficiently
predictive for the animal demise.
We also examined the decrease in body temperature (BT) during 3 to 7
consecutive days (whatever the initial BT) by calculating the
difference in BT between the 1st and the last of these 3, 4, 5, 6 or 7
days. In fact, when looking at Figure 2D, all deceased animals
presented BT decrease of 1.5 to 4 °C over a two to three days period
during the few days preceding death. We also considered 3-days BT
decrease before the haematological NADIR, since the NADIR is a
critical, characteristic point during the development of
haematopoietic syndrome. Ultimately, none of these variables showed a
significant difference between surviving and dying animals (Student’s
t test, data not shown).
|
|
Figure 2. Daily record of behaviour score
(upper row) and body temperature (lower row) for animals
deceased during the experiments (A, D) and for three surviving
animals with similar irradiation and treatment protocol (C, F).
Each of these animals showed a different pattern of variation.
The comparison of maximal values for the behaviour score (B) and
minimal body temperature (E) observed for each individual animal
either deceased (circles) or alive (squares) did not show
significant difference (n.s.) between these two groups
(Student’s t test). Click image to enlarge |
Posterior predictive results: univariate logistic regressions
Table 3 shows the Bayesian point estimates (i.e. posterior median),
the 95% credible intervals (CI) and the estimated values for the three
(average) PPS (i.e., LogS, BS and 01S) for 14 univariate logistic
regression models, and the simplest model without any covariate
(called “Intercept”). For a given model, the lower the BS or the LogS
score are, the more plausible the prediction is. Inversely, the higher
the 01S is, the more plausible the prediction is. The analysis first
focused on individual primate-specific covariates that may influence
the outcome directly, namely treatment of the haematopoietic syndrome,
radiation dose, age and body mass of animals at the time of
irradiation. Univariate logistic regressions accounting for each of
these covariates provided higher LogS and BS than the intercept model,
meaning that the predictions of survival status are less accurate and
precise when accounting for these covariates than when assuming that
all the primates have the same probability of death. This in turn
suggests that the outcome is not significantly influenced by these
covariates, thus allowing for the analysis of other covariates as
potential HEP independently from the above-mentioned covariates (Table
3).
We analysed the predictive ability of other univariate logistic
regressions including covariates such as minimal body temperature (BT)
before the NADIR, BT during the overall experiment, maximal
Flt3-ligand concentration in the blood, maximal slope of BT decrease
(defined as the difference in BT during 2, 3, 4, 5, 6 or 7 consecutive
days), and maximal clinical/behavioural score (MBS). The variation in
BT appears as the most relevant covariate to consider in terms of
predictive performances. The univariate model based on the decrease of
BT during 3 consecutive days provided a lower LogS, a lower BS and a
higher 01S score than the intercept model meaning that the predictions
of survival status were more plausible. Moreover, this model also
clearly provided the lowest LogS, among all considered univariate
regression models, meaning that the posterior probability to predict
the observed vital status from this model was higher on average over
the 15 primates. It should also be noted that, even if its LogS is
higher than the intercept model and the model based on the 3-days BT
decrease, the models based on the 5-day and 7-day BT decrease also
gave plausible predictions. In particular, the 3-day BT decrease
provided the lowest BS and the highest 01S among all considered
univariate regression models. In conclusion, it should be noted that,
even if different from zero, the number of failed predictions relative
to the three deceased animals is also the lowest (i.e., 1/3) for the
models based on the 3-day, 5-day and 7-day BT decrease. The univariate
regression including only the maximal clinical/behavioural average
score or only the maximal FL concentration in the blood showed very
poor predictive performances. This suggests that none of these
covariates whether they rely on clinical score, behaviour, or
physiological variables can be considered alone as a HEP.
Posterior predictive results: multivariate logistic regressions
In order to improve the survival prediction, bivariate and trivariate
logistic regression models were also fitted, including several
combinations of minimal BT, radiation dose, maximal
clinical/behavioural score, and 3-day maximal BT decrease. Table 3
shows that the inclusion of radiation dose, either with the 3-day
maximal BT decrease or with the minimal BT before the NADIR, decreased
the predictive ability of the two BT-associated covariates tested in
univariate logistic regression. This tends to confirm that
primate-specific covariates do not significantly influence the outcome
and cannot be used as HEPs, and that only covariates measured during
the course of the acute radiation syndrome are of interest for the
definition of HEPs at least in the present dataset.
Table 3 also shows that the smallest values obtained for the average
logS and BS are for the bivariate logistic regression accounting for
both the maximal 3-day BT decrease and the maximal behaviour score.
Two predictive scores among three are in agreement with the superior
predictive performance of this model to reproduce both accurate and
precise primate survival status. The inclusion of the maximal
behaviour score increases the predictive ability of these bivariate
models, although this behaviour score gave poor results when tested in
an univariate logistic regression. The best predictive model is
therefore the bivariate model including the maximal behaviour score
and the maximal 3-day BT decrease. This result underlines the
potential of using a combination of covariates as an HEP to predict
the death of animals.
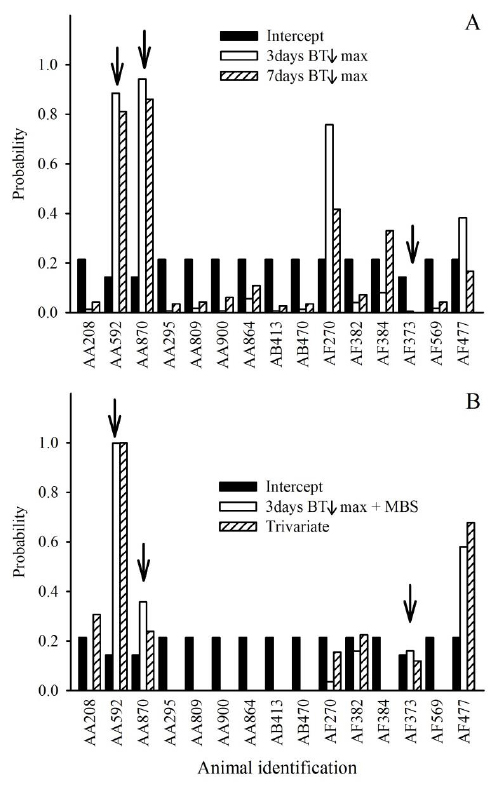
In comparing the predictive scores (Table 3) and the predicted
probabilities of death (Figure 3) for the univariate (Figure 3A),
bivariate and trivariate (Figure 3B) regressions accounting for the
3-day BT decrease max, one can see that the maximal behaviour score
contributes to the reduction of the prediction uncertainty. For the
primates alive at the end of the experiment, the predicted probability
of death is generally closer to zero for the bivariate and the
trivariate as compared to the Intercept model and the univariate
regressions. For two of the three deceased primates, the predicted
probability of death is closer to one for the bivariate and the
trivariate than for the univariate regression. In particular, the
bivariate regression accounting for both the maximal 3-day BT decrease
and the maximal behaviour score attributes a probability of death of
0.16 to primate AF373 whereas it is 0.006 and 0.001 respectively for
the univariate regression only accounting for the 3- or 7-day BT
decrease max.
When comparing the bivariate and the trivariate regressions, it
appears that for the three deceased animals, the predicted probability
of death is similar. However, when looking at the surviving animals,
the trivariate regression gave higher probability of death as compared
to the bivariate regression. We can conclude that the trivariate model
is less efficient in predicting the survival of animals, confirming
the interest of the bivariate model as a predictor of survival.
The average 0-1 score does not confirm the results obtained with the
Brier and the LogS scores. The best predictive models according to
this 0-1 score (i.e. with the highest 01S = 0.93) are the univariate
logistic regressions only accounting for the maximum decrease in BT
during 5 or 7 days. Nevertheless, Table 3 shows that this predictive
score is not discriminative enough between the models. It assigns the
same score (equal to 0.80) to the intercept model (model without any
covariate) and the bivariate regression accounting for both the max 3
days BT decrease and the maximal behaviour score. Figure 3 shows that
the intercept model provides less plausible predictions, especially
for surviving animals. Even if the above bivariate regression leads to
two failed predictions (score=0.80) compared to one failed prediction
for the univariate logistic regression only accounting for the maximal
body temperature decrease during 5 and 7 consecutive days
(score=0.93), the provided predictions are more accurate and precise,
explaining why the logarithmic and Brier scores are lower for the
former than the latter model.
|
|
Figure 3. Predicted probabilities of death before 60 days after irradiation for the 15 studied primates provided by A: Intercept model not taking into account any covariate and univariate regression models accounting for the maximal BT decrease during 3 and 7 consecutive days.
B: Intercept model not taking into account any covariate,
bivariate regression model accounting for both the maximal 3
days BT decrease and the maximal behaviour score, and trivariate
regression accounting for the maximal 3 days BT decrease,
radiation dose and maximal behaviour score. The arrows indicate
the 3 deceased primates. Click image to enlarge |
Discussion
The irradiation protocol used in these experiments induced a severe ARS with haematopoietic, digestive, liver, kidney and possible lung damage, called a radiation-induced multiple organ disease syndrome (Bertho et al. 2005b; Fliedner et al. 2005). In humans, such radiation-induced syndrome is dramatically difficult to reverse and the treatment of the haematopoietic syndrome, even combined with strong clinical support, does not always prove to be sufficient to ensure the survival of patients (MacVittie and Monroy 1990; Coeytaux et al. 2015). In this study, this is exemplified by the fact that each of the three animals that died received a different haematopoietic treatment and that the unique control animal (AB470) receiving only clinical support – without any cell graft or growth factor treatment - did survive the irradiation. The number of animals considered in this retrospective study was low (i.e. 15) due to the initial experimental design. In fact, in each experiment, the number of animals was restricted to the minimum judged necessary and the number of control was restricted to one in accordance with one of the three Rs principle, the reduction (Russell and Burch 1959). Based on this, the statistical analysis of such a limited sample size, with numerous different experimental conditions, was hampered by a very limited statistical power. In this case, Bayesian statistical framework presents several advantages to identify the most predictive factors of animals’ survival. First, it allows accounting for parameters estimation uncertainty (which may be large for samples of small size) in the prediction of survival status. This prevents overconfident predictions. Moreover, Bayesian approach can accommodate small-sized samples as it allows integrating additional information (i.e., expert knowledge or previous similar experimental studies) in the logistic regression models through informative prior distributions on the unknown regression coefficients. That being said, we did not use this latter feature due to the sparse description and analysis of HEP in non-human primates after total body irradiation.
A first analysis based on univariate logistic regression models
strongly suggested that, despite the heterogeneity of body mass and
age at the time of irradiation, the heterogeneity of radiation dose
(two different protocols) and the heterogeneity of haematological
treatment (five different protocols including one untreated animal),
these primate-specific covariates did not allow for predicting the
three observed deaths in the group of 15 animals. This suggested that
the death of animals was independent from these four covariates and
especially from the treatment in these studies. In fact, the treatment
efficiency was not measured by the mean of survival but mainly by the
monitoring of haematological variables such as duration of aplasia and
time to normalization of neutrophil counts (Bertho et al. 2002; Bertho
et al. 2005a; Bertho et al. 2005b). The animal survival was an
absolute requirement as an experimental endpoint in these experiments,
which in turn explained the low number of deceased animals and the
absence of influence of these primate-specific covariates on the PPD
of the survival status. On the basis of this first univariate
analysis, we assumed that this group of animals was sufficiently
homogeneous to conduct a global analysis of covariates measured after
irradiation and potentially useful as HEPs.
The analysis then focused on univariate regression models based on some specific covariates that were easy to follow during the course of these experiments: a mean behaviour score and the minimal BT. The minimal BT was described as a reliable predictive indicator of death in septic shock model in rodents (Nemzek et al. 2004). Additionally, tracking BT was frequently proposed as an indicator of animal status (Kort et al. 1998; Morton 1998). In our model, the minimal BT alone was proven not sufficiently predictive of the death of animals to be used as an HEP. Our results are in accordance with a previous study in irradiated NHP which used hypothermia at <34.6°C as a HEP and in which no animal was euthanized according to this criteria (Menon et al. 2016). Moreover, the visual inspection of individual BT data showed important variations in BT during the critical phase of ARS. This suggested that the rate of BT decrease could be also an important covariate to consider as an HEP. In order to consider this, we studied the predictive ability of univariate logistic regressions based on the maximal BT decrease during 2, 3, 4, 5, 6 or 7 continuous days. The results suggested that the maximal 3-day decrease in BT was one of the most interesting covariate to consider for death prediction, especially when considering the average BS and LogS scores. Even if the associated logistic regression model allowed for the correct prediction of survival status in 14 out of 15, it failed to predict the death of the NHP AF373. This is also in accordance with studies in a rodent model of septic shock in which large variations in BT were observed but were not an accurate and precise predictive indicator of death (Krarup et al. 1999) as well as in irradiated NHPs (Menon et al. 2016). In an attempt to improve the predictive ability of this model, one or two additional covariates were included in the logistic regression models. The results clearly indicated that the combination of the maximal clinical/behaviour score with the maximal 3-day BT decrease lead to the most efficient model to predict survival outcome. This result highlights the value of using a combination of variables as an HEP rather than one single variable, as suggested in previous works (Wolfensohn et al. 2015; Fante et al. 2007; Graham et al. 2012).
Although not mandatory at the time the initial experiments were
performed, this retrospective study was conducted in the context of
the new French regulation (Ministry of agriculture Act No 2013-118,
2013) according to the European directive 2010/63 (2010) in which the
retrospective analysis of the protocol severity is mandatory for
refining animal use. During the experiments, most of the single HEPs
provisionally defined before these experiments were changed during the
course of the experiments, due to increasing level of nursing,
allowing the animals to survive with minimally acceptable welfare
conditions. This was also due to the estimated general status of the
animals which could appear better than what the composite score alone
would have implied. For instance, animal AF373 that stayed for 4 days
at a high composite score value before dying also showed signs of
haematopoietic recovery (through decrease in FL concentration and
increasing numbers of WBC) and a rise in BT. Thus when looking at
these haematopoietic variables, it was justified to postpone
preventive euthanasia. Accordingly, a discrepancy appeared in several
cases between the general status of the animals and the results of the
composite score. This in turn suggests that the use of a fixed HEP
might induce non adequate decisions regarding the termination of the
experiment. Moreover, these results suggest that other variables,
either physiological or behavioural, should be included to catch
clinical signs coming from physiological systems other than the
haematopoietic system, the main interest in this set of experiments.
Overall, this study shows that a multi-variable approach is mandatory,
and that this is in accordance with previous studies (Graham et al.
2012; Fante et al. 2007; Wolfensohn et al. 2015), even if in the
course of this study, not all deaths and all survivals were accurately
predicted by the multivariate analysis.
Two variables stand out in importance when used in combination: the
maximal slope of body temperature decrease and the mean
clinical/behaviour score. The initial development of the provisionally
defined HEPs with these two covariates showed the lowest LogS and BS
scores, suggesting that nursing adaptation is essential to improve
animal conditions, facilitating animal survival despite the elevated
scores observed in some cases. However, when looking at individual
results this combination of two variables fails to predict the death
of one NHP (AF373) and the survival of another NHP (AF477), and
predicted the death of a third NHP (AF870) with a low probability. The
small number of animals in the present study limits the accuracy of
predictions.
The study also brought to light that the clinical/behaviour score is
based on a limited number of criteria. It would be desirable to refine
this clinical/behaviour score through the inclusion of other criteria
such as the use of enrichment tools by NHP, the measurement of
spontaneous ambulatory activities, or by quantifying already used
criteria with more precision. Other physiological variables could also
be used such as cardiac frequency or breathing rate, although these
are more difficult to measure with NHPs without putting more
constraints on the animals (such as telemetry probes).
Another limitation of this retrospective study is the inability to
determine a threshold of action for each of the putative endpoints
used. This limitation is in part due to the small number of animals
included. The threshold of action could be defined by using the
results of other studies with animals under similar experimental
conditions. Another way to try to define the threshold of action might
be through the specification of informative prior distributions on the
unknown coefficients in the logistic regression models. Ultimately, a
combination of these two different approaches may lead to a more
accurate definition of potential threshold of action. Nevertheless
this Bayesian multi-variable approach is an interesting tool for
assessing reliable humane end points and demonstrated the merit of a
multi-criteria analysis of the clinical status of NHPs. This
multi-criteria approach should be adapted to each experimental
situation and to each kind of stressor and should also be adapted
during the course of the experiment through the frequent oversight of
animals to detect slight changes in their behaviour. It is therefore
essential to have the best possible knowledge of the
clinical/behaviour of each individual animal entering this kind of
experiment with a high level of potential suffering.
Acknowledgements
The authors wish to thank the expert animal care of R. Riou and S. Jacquin throughout these experiments, as well as all the people who participated in these experiments and co-authored previously published works. We also wish to thank Chugai Pharma France for providing us with G-CSF (Lenogastim©), and the financial support of Electricité de France (EDF) to these NHP experiments.
Conflict of interest
The authors declared no potential conflict of interest.
References
- Becker, M.J., De Marie, S., Bakker-Woudenberg, I.A.J.M., (1998). Clinical signs predicting imminent death in a rat model of invasive pulmonary aspergillosis. In: Hendriksen, C.F.M., Steen, B., Cussler, K., Morton, D.B., (eds.). Humane endpoints in animal experiments for biomedical research. London: RSM Press.
-
Bernardo, J.M., Smith, A.F.M., (2008). Bayesian theory. New-York,
John Wiley and sons, Ltd.
Bertho, J.M., Demarquay, C., Frick, J., Joubert, C., Arenales, S., Jacquet, N., Sorokine-Durm, I., Chau, Q,., Lopez, M., Aigueperse, J., Gorin, N.C., Gourmelon, P., (2001). Level of Flt3-ligand in plasma: a possible new bio-indicator for radiation-induced aplasia. International Journal of Radiation Biology. 77, 703-712. - Bertho, J.M., Frick, J., Demarquay, C., Lauby, A., Mathieu, E., Dudoignon, N., Jacquet, N., Trompier, F., Chapel, A., Joubert, C., Lopez, M., Aigueperse, J., Gorin, N.C., Gourmelon, P., Thierry, D., (2002). Reinjection of ex vivo-expanded primate bone marrow mononuclear cells strongly reduces radiation-induced aplasia. Journal of Hematotherapy Stem Cell Research. 11, 549-564.
- Bertho, J.M., Frick, J., Prat, M., Demarquay, C., Dudoignon, N., Trompier, F., Gorin, N.C., Thierry, D., Gourmelon, P., (2005a). Comparison of autologous cell therapy and granulocyte-colony stimulating factor (G-CSF) injection vs. G-CSF injection alone for the treatment of acute radiation syndrome in a non-human primate model. International Journal of Radiation Oncology, Biology, Physics. 63, 911-920.
- Bertho, J.M., Prat, M., Frick, J., Demarquay, C., Gaugler, M.H., Dudoignon, N., Clairand, I., Chapel, A., Gorin, N.C., Thierry, D., Gourmelon, P., (2005b). Application of autologous hematopoietic cell therapy to a nonhuman primate model of heterogeneous high-dose irradiation. Radiation Research. 163, 557-570.
- Bertho, J.M., Roy, L., Souidi, M., Benderitter, M., Gueguen, Y., Lataillade, J.J., Prat, M., Fagot, T., De Revel, T., Gourmelon, P., (2008). New biological indicators to evaluate and monitor radiation-induced damage: an accident case report. Radiation Research. 169, 543-550.
-
Brier, G.W., (1950). Verification of forecasts expressed in terms of
probability. Monthly Weather Review. 78, 1-3.
Coeytaux, K., Bey, E., Christensen, D., Glassman, E.S., Murdock, B., Doucet, C., (2015). Reported radiation overexposure accidents worldwide, 1980-2013: a systematic review. PLoS One. 10, e0118709. -
Cui, W., Bennett, A.W., Zhang, P., Barrow, K.R., Kearney, S.R.,
Hankey, K.G., Taylor-Howell, C., Gibbs, A.M., Smith, C.P.,
MacVittie, T.J., (2016). A non-human primate model of
radiation-induced cachexia. Scientific Reports. 6, 23612.
Densow, D., Kindler, H., Baranov, A.E., Tibken, B., Hofer, E.P., Fliedner, T.M., (1997). Criteria for the selection of radiation accident victims for stem cell transplantation. Stem Cells. 15, Suppl 2, 287-297. - Fante, F., Boldrin, M., Polito, L., Ravarotto, L., Castagnaro, M., Hutabba, S., Cozzi, E., Ancona, E., (2007). Refinement of a transplantation project in the non-human primate by the use of a humane endpoint. Laboratory Animals. 41, 456-469.
- Farese, A.M., Cohen, M.V., Katz, B.P., Smith, C.P., Jackson, W., Cohen, D.M., MacVittie, T.J., (2012). A nonhuman primate model of the hematopoietic acute radiation syndrome plus medical management. Health Physics. 103, 367-382.
- Fliedner, T.M., Dorr, H.D., Meineke, V., (2005). Multi-organ involvement as a pathogenetic principle of the radiation syndromes: a study involving 110 case histories documented in SEARCH and classified as the bases of haematopoietic indicators of effect. The British Journal of Radiology. Suppl, 27, 1-8.
- Geisser, S., Eddy, W.F., (1979). A Predictive Approach to Model Selection. Journal of American Statistical Association. 74, 153-160.
- Gelman, A., Carlin, J.B., Stern, H.S., Dunson, D.B., Vehtari, A., Rubin, D.N., (2013). Bayesian data analysis, third edition., Abingdon, Chapmann and Hall/CRC press.
- Gneiting, T., Raferty, A.E., (2007). Strictly Proper Scoring Rules, Prediction, and Estimation. Journal of American Statistical Association. 102, 359-378.
-
Goans, R.E., Waselenko, J.K., (2005). Medical management of
radiological casualties. Health Physics. 89, 505-512.
Good, I.J., (1952). Rational Decisions. Journal of the Royal Statistical Society. Series B (Methodological). 14, 107-114. -
Graham, M.L., Mutch, L.A., Kittredge, J.A., Rieke, E.F., Robinson,
N.A., Zolondek, E.K., Faig, A.W., Dufour, T.A., Munson, J.W.,
Schuurman, H.J., (2012). Management of adverse side-effects after
chemotherapy in macaques as exemplified by streptozotocin: case
studies and recommendations. Laboratory Animals. 46, 178-192.
Herodin, F., Drouet, M., (2002). Autologous cell therapy as a new approach to treatment of radiation-induced bone marrow aplasia: preliminary study in a baboon model. Canadian Journal of Physiology and Pharmacology. 80, 710-716. - Herodin, F., Roy, L., Grenier, N., Delaunay, C., Baugé, S., Vaurijoux, A., Gregoire, E., Martin, C., Alonso A., Mayol, J.F., Drouet, M., (2007). Antiapoptotic cytokines in combination with pegfilgrastim soon after irradiation mitigates myelosuppression in nonhuman primates exposed to high irradiation dose. Experimental Hematology. 35(8). 1172-1181.
- Hirama, T., Tanosaki, S., Kandatsu, S., Kuroiwa, N., Kamada, T., Tsuji, H., Yamama, S., Katoh, H., Yamamoto, N., Tsujii, H., Suzuki, G., Aakashi, M., (2003). Initial medical management of patients severely irradiated in the Tokai-mura criticality accident. The British Journal of Radiology. 76, 246-253.
- Huchet, A., Belkacemi, Y., Frick, J., Prat, M., Muresan-Kloos, I., Altan, D., Chapel, A., Gorin, N.C., Gourmelon, P., Bertho, J.M., (2003). Plasma Flt-3 ligand concentration correlated with radiation-induced bone marrow damage during local fractionated radiotherapy. International Journal of Radiation Oncology, Biology, Physics. 57, 508-515.
-
Kort, W.J., Hekking-Wejima, J.M., Tenkate, M.T., Sorm, V., Vanstrik,
R., (1998). A microchip implant system as a method to determine body
temperature of terminally ill rats and mice. Laboratory Animals. 32,
260-269.
Krarup, A., Chattopadhyay, P., Bhattacharjee, A.K., Burge, J.R., Ruble, G.R., (1999). Evaluation of surrogate markers of impending death in the galactosamine-sensitized murine model of bacterial endotoxemia. Laboratory Animal Science. 49, 545-550. - Lunn, D., Jackson, C., Best, N., Thomas, A., Spiegelhalter, D., (2012). The BUGS book: a practical introduction to bayesian analysis. Abingdon, Chapman & Hall/CRC press.
-
MacVittie, T.J., Monroy, R.L., (1990). Potential improvement in the
management of seriously irradiated persons. In: Ricks, RC, Fry, SA
(eds.) The medical basis for radiation accident preparedness II. New
York, Elsevier.
Menon, N., Rogers, C.J., Lukaszewicz, A.I., Axtelle, J., Yadav, M., Song, F., Chakravarti, A., Jacob, N.K., (2016). - Detection of Acute Radiation Sickness: A Feasibility Study in Non-Human Primates Circulating miRNAs for Triage in Radiological Events. PLoS One. 11, e0167333.
- Morton, D.B., (1998). Humane end points in animal experimentation for biomedical research: ethical, legal and practical aspects In: Hendriksen, C.F.M., Steen, B., Cussler, K., Morton, D.B., (eds.). Humane endpoints in animal experiments for biomedical research. London, RSM Press.
- Nemzek, J.A., Xao, H.Y., Minard, A.E., Bolgos, G.L., Remik, D.G., (2004). Humane endpoints in shock research. Shock. 21, 17-25.
- Olfert, E.D., Godson, D.L., (2000). Humane endpoints for infectious disease animal models. ILAR Journal. 41, 99-104.
- Prat, M., Demarquay, C., Frick, J., Dudoignon, N., Thierry, D., Bertho, J.M., (2006). Use of flt3 ligand to evaluate residual hematopoiesis after heterogeneous irradiation in mice. Radiation Research. 166, 504-511.
- Prat, M., Demarquay, C., Frick, J., Thierry, D., Gorin, N.C., Bertho, J.M., (2005). Radiation-induced increase in plasma Flt3 ligand concentration in mice: evidence for the implication of several cell types. Radiation Research. 163, 408-417.
-
Russell, W.M.S., Burch, R.L., (1959). The principles of humane
experimental technique. London, Methuen.
Thierry, D., Bertho, J.M., Chapel, A., Gourmelon, P., (2005). Cell therapy for the treatment of accidental radiation overexposure. The British Journal of Radiology. Suppl, 27, 175-179. - Williams, J.P., Brown, S.L., Georges, G.E., Hauer-Jensen, M., Hill, R.P., Huser, A.K., Kirsch, D.G., MacVittie, T.J., Mason, K.A., Medhora, M.M., Moulder, J.E., Okunieff, P., Otterson, M.F., Robbins, M.E., Smathers, J.B., McBride, W.H., (2010). Animal models for medical countermeasures to radiation exposure. Radiation Research. 173, 557-78.
-
Wolfensohn, S., Sharpe, S., Hall, I., Lawrence, S., Kitchen, S.,
Dennis, M., (2015). Refinement of welfare through development of a
quantitative system for assessment of lifetime experience. Animal
Welfare. 24, 139-149.